

Peloton is gradually rolling out a redesigned profile in the app, adding a customizable progress dashboard, more detailed activity views, and a new Training Load metric.
The update lets members hide some metrics they don’t want to see and reorder the information on their dashboard. The screenshots below show the new layout in the iOS app. As this is a gradual rollout, you may still see the previous version when opening your profile.
The icon at the bottom right of the app still opens the profile page, with Progress, History, and Achievements tabs. Those tabs were part of Peloton’s 2025 profile refresh. This update changes the information and layout within the Progress view.
At the top, the dashboard displays your fitness goal and a compact “This month” card with active days, your weekly streak, and a small calendar. The existing Peloton IQ weekly insights cards sit below that monthly summary.
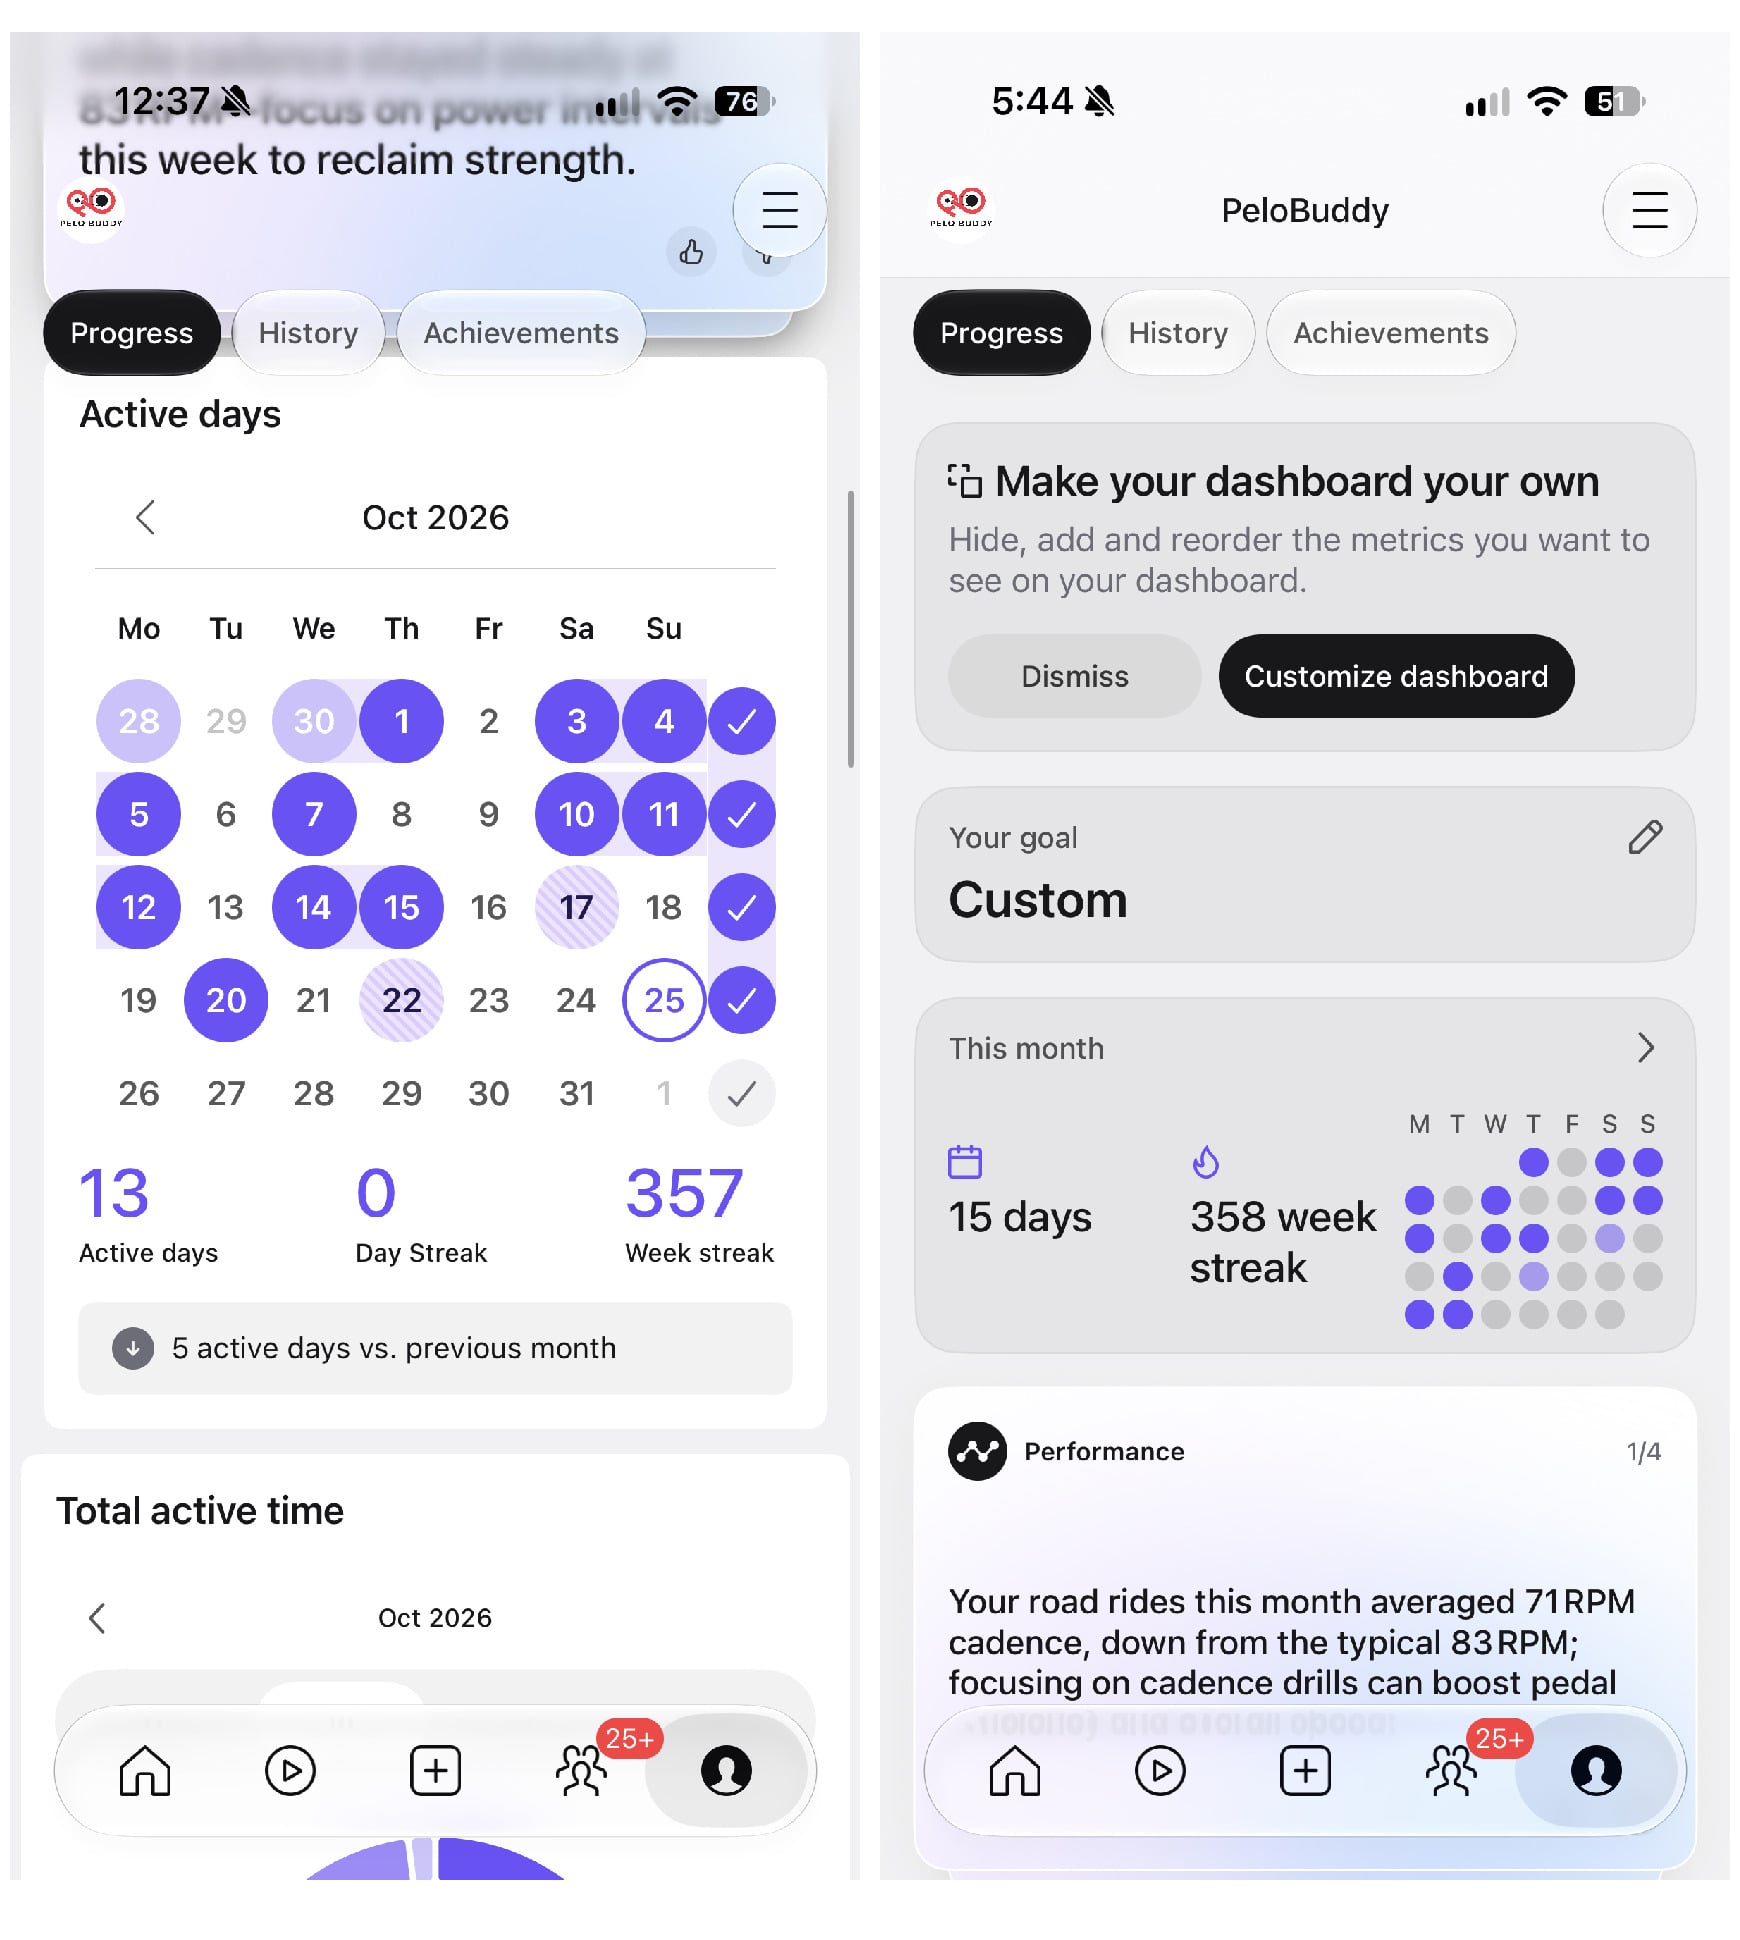
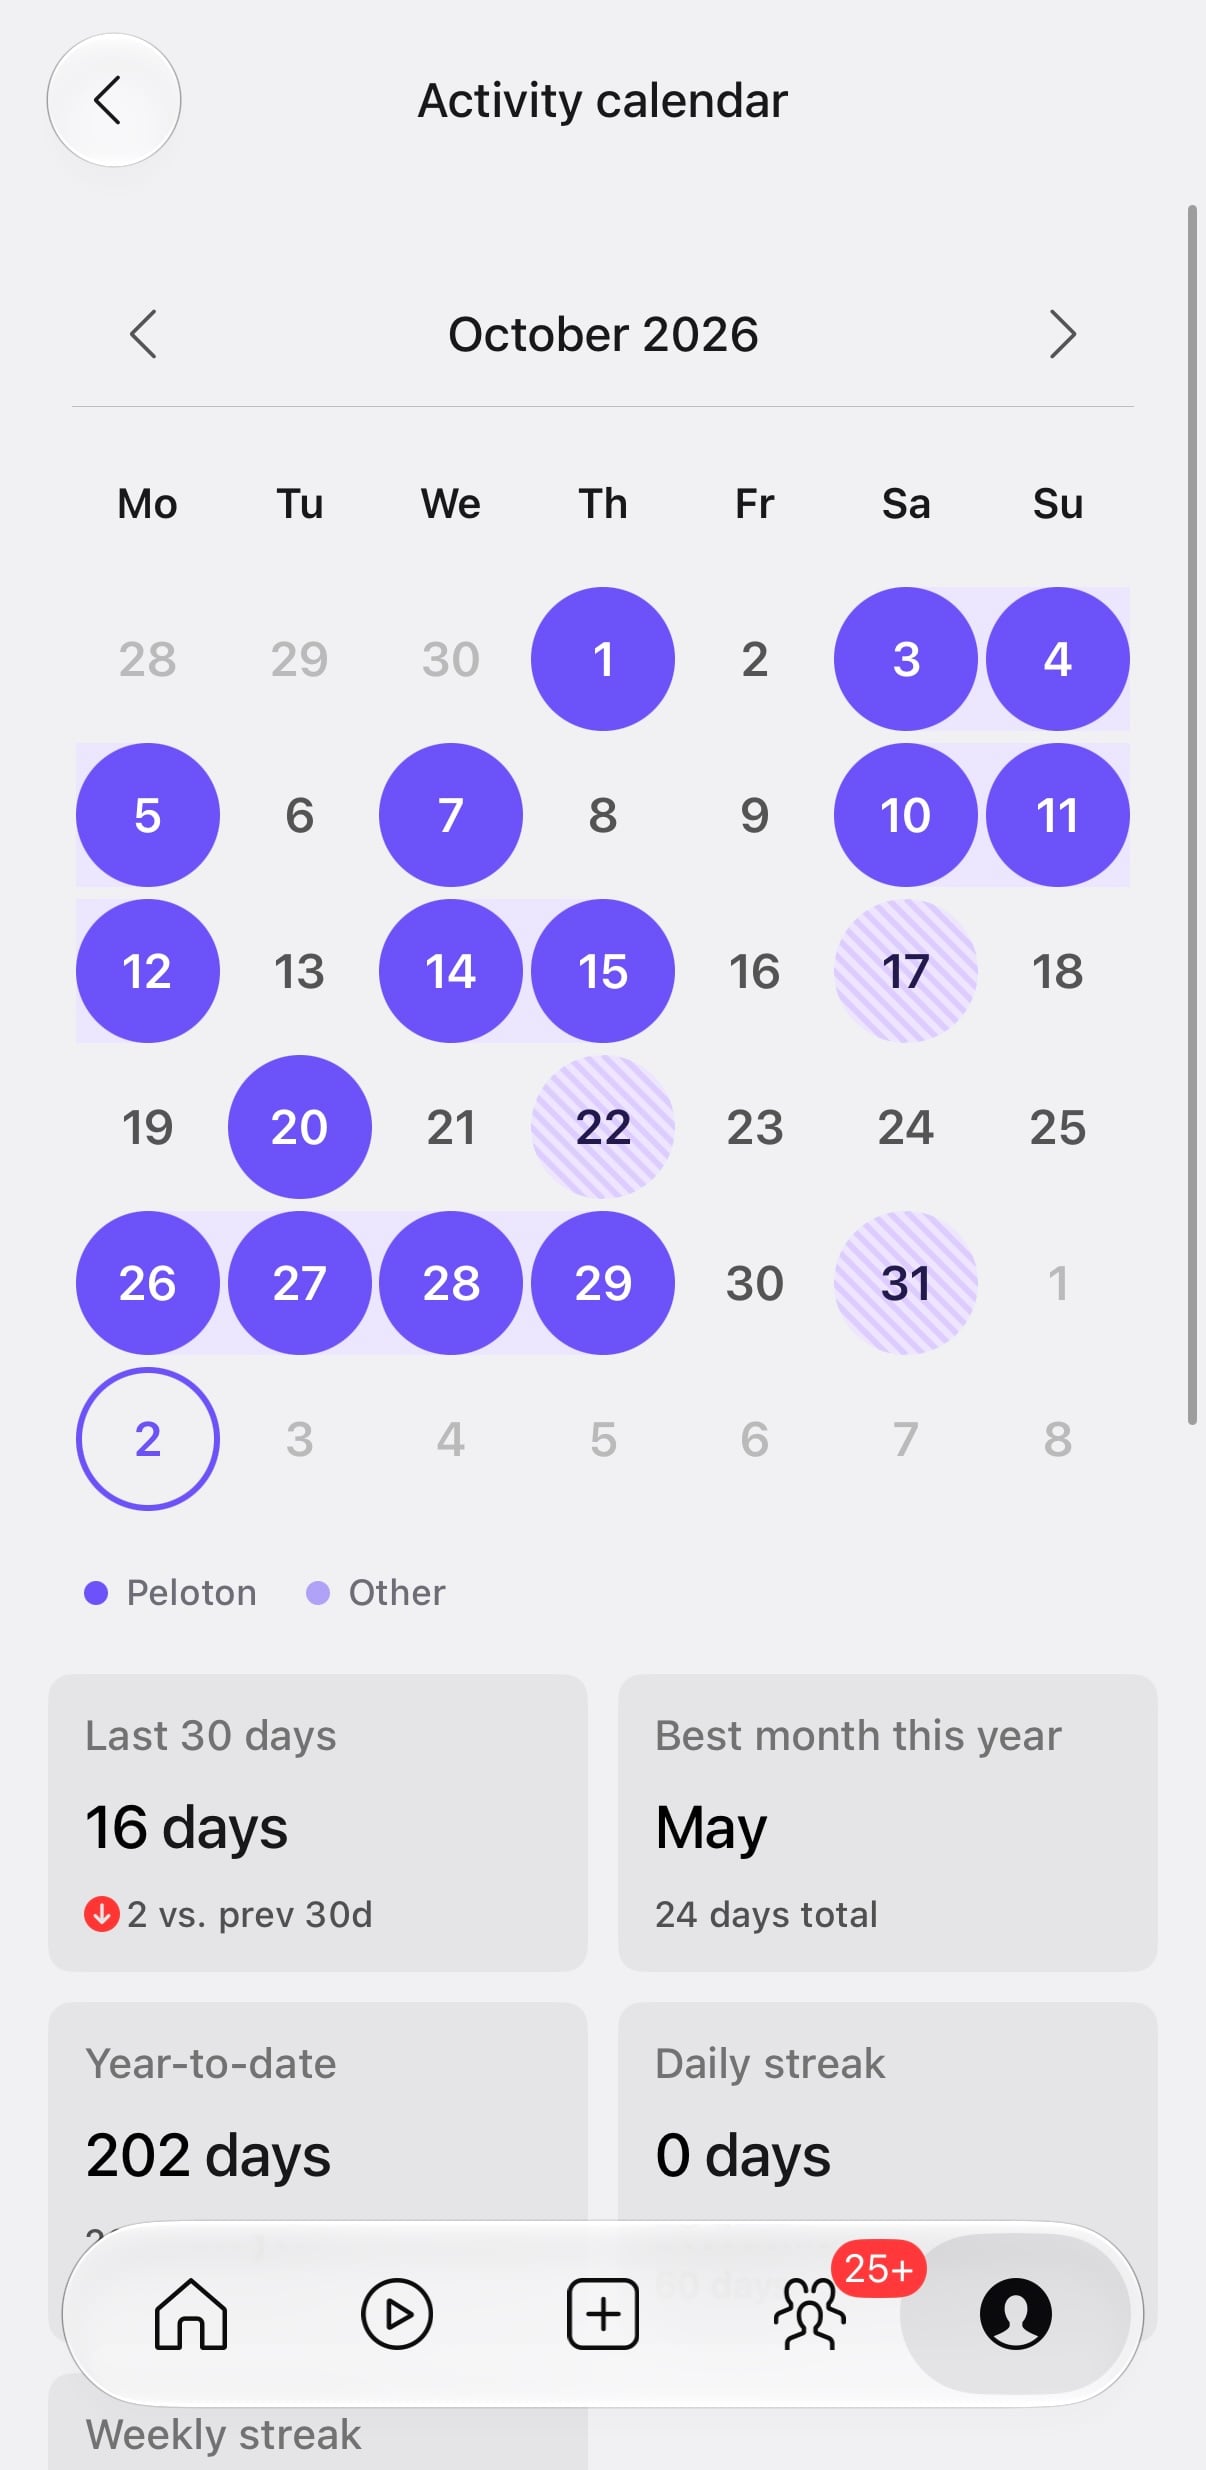
Opening the monthly card brings up the full Activity calendar, with arrows to move between months. Below the calendar are active-day totals for the last 30 days, your best month this year, and the year to date, followed by daily and weekly streaks.
The calendar uses solid circles for Peloton activity and striped circles for other workouts, a change Peloton made when they added streak credit for imported third-party workouts in May.
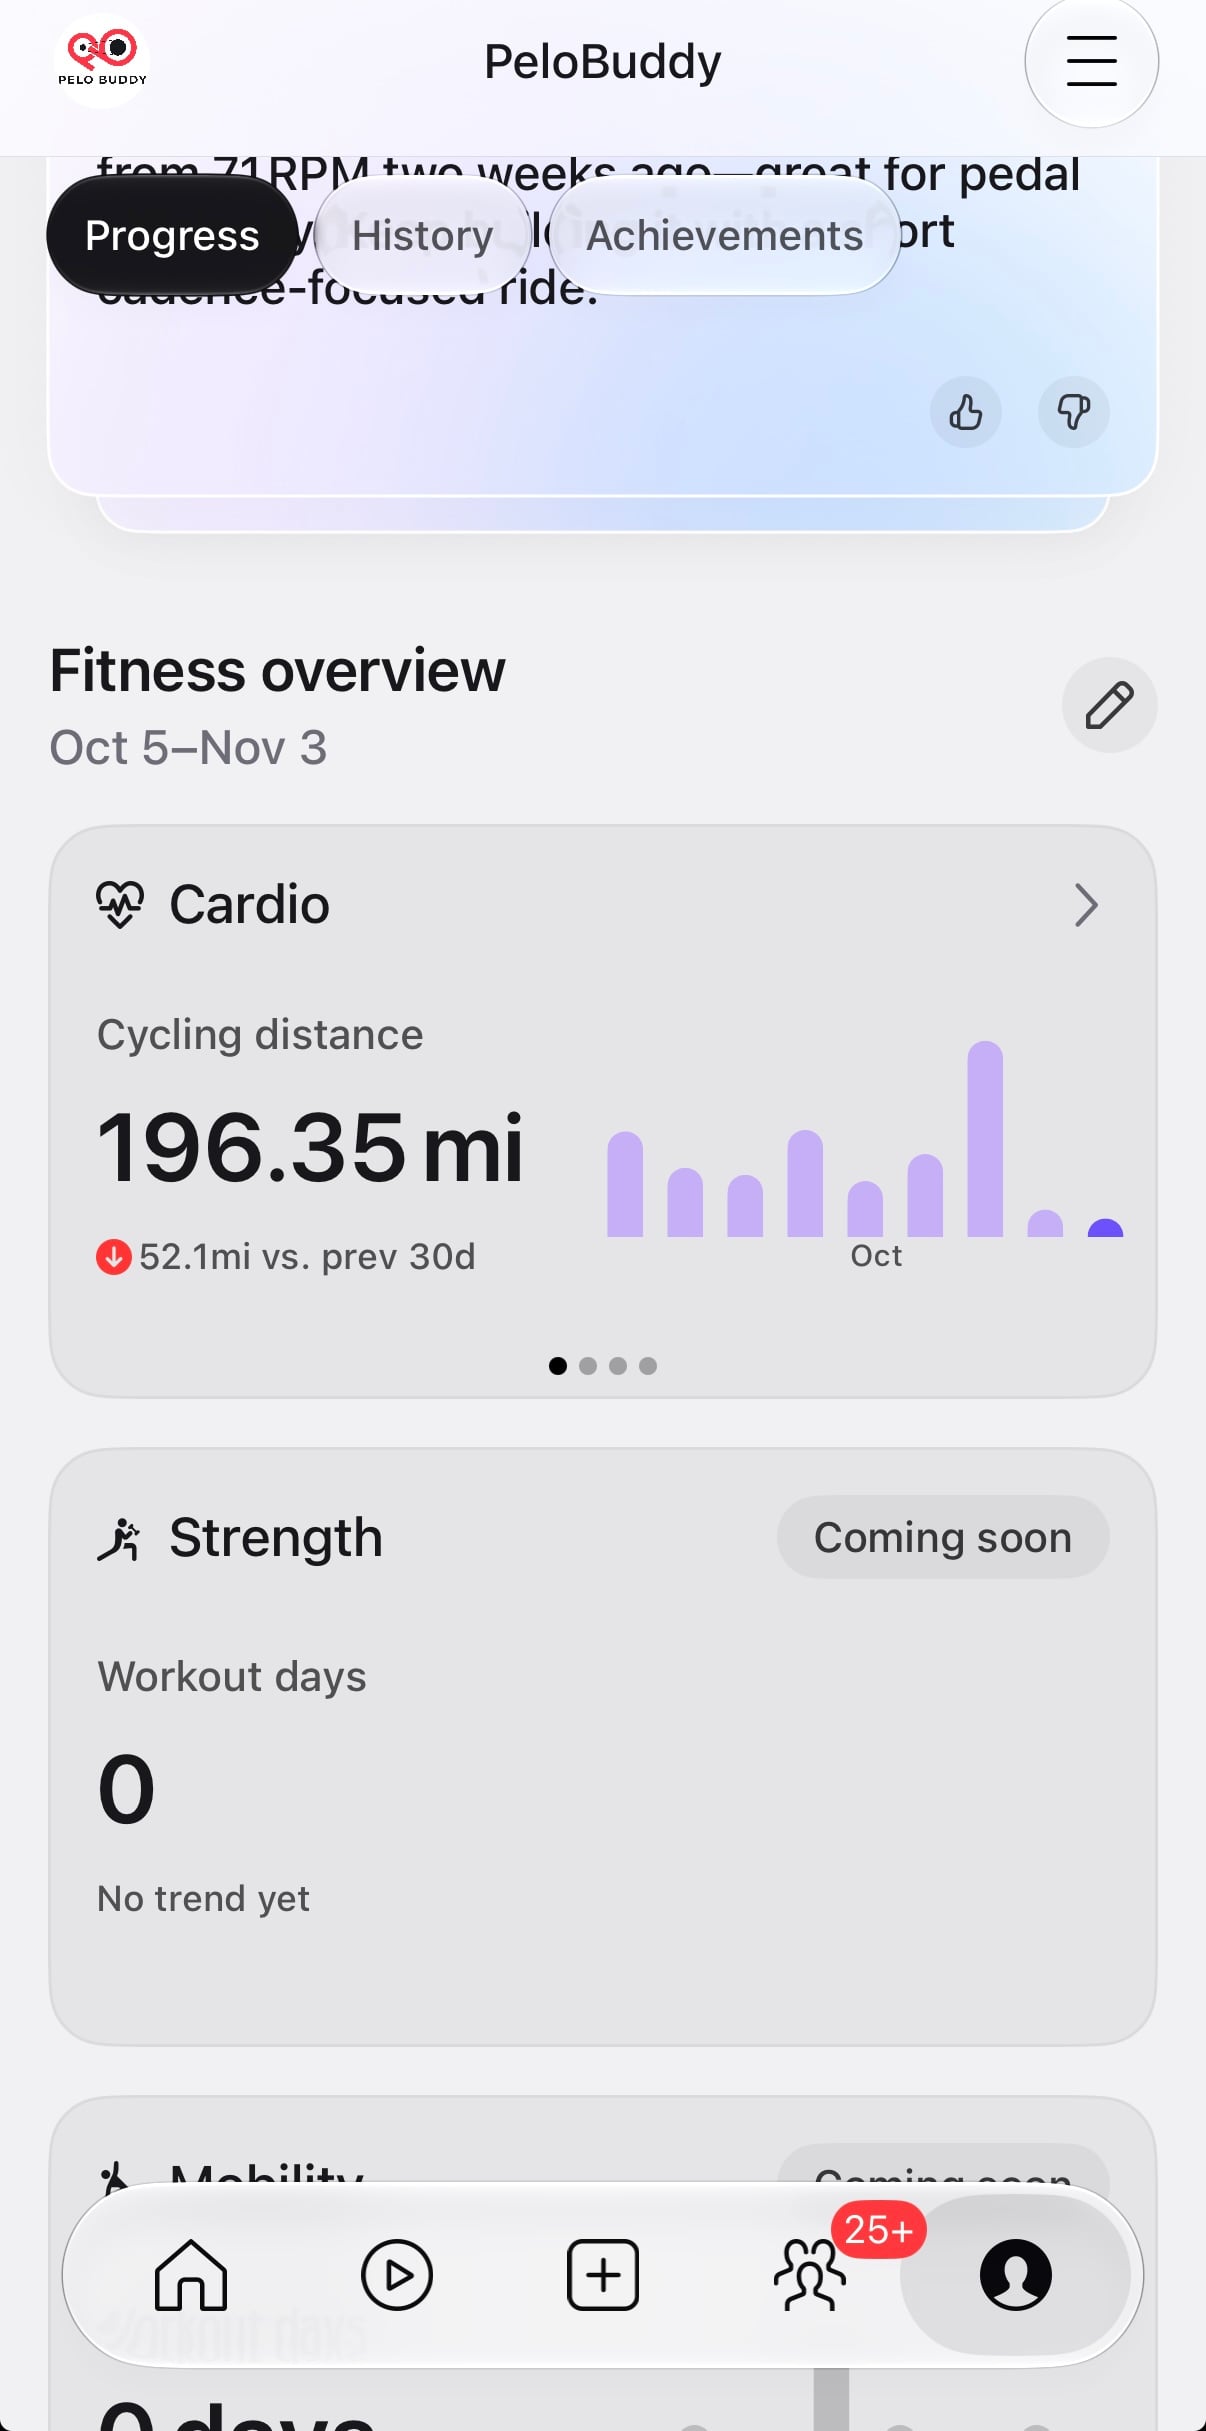
Below the insights, the new dashboard is divided into Fitness overview, Activity summary, and All time sections.
Fitness overview has cards for Cardio, Strength, and Mobility. The Cardio example shown here displays cycling distance, a comparison with the previous 30 days, and a trend chart. Dots beneath the card indicate additional views.
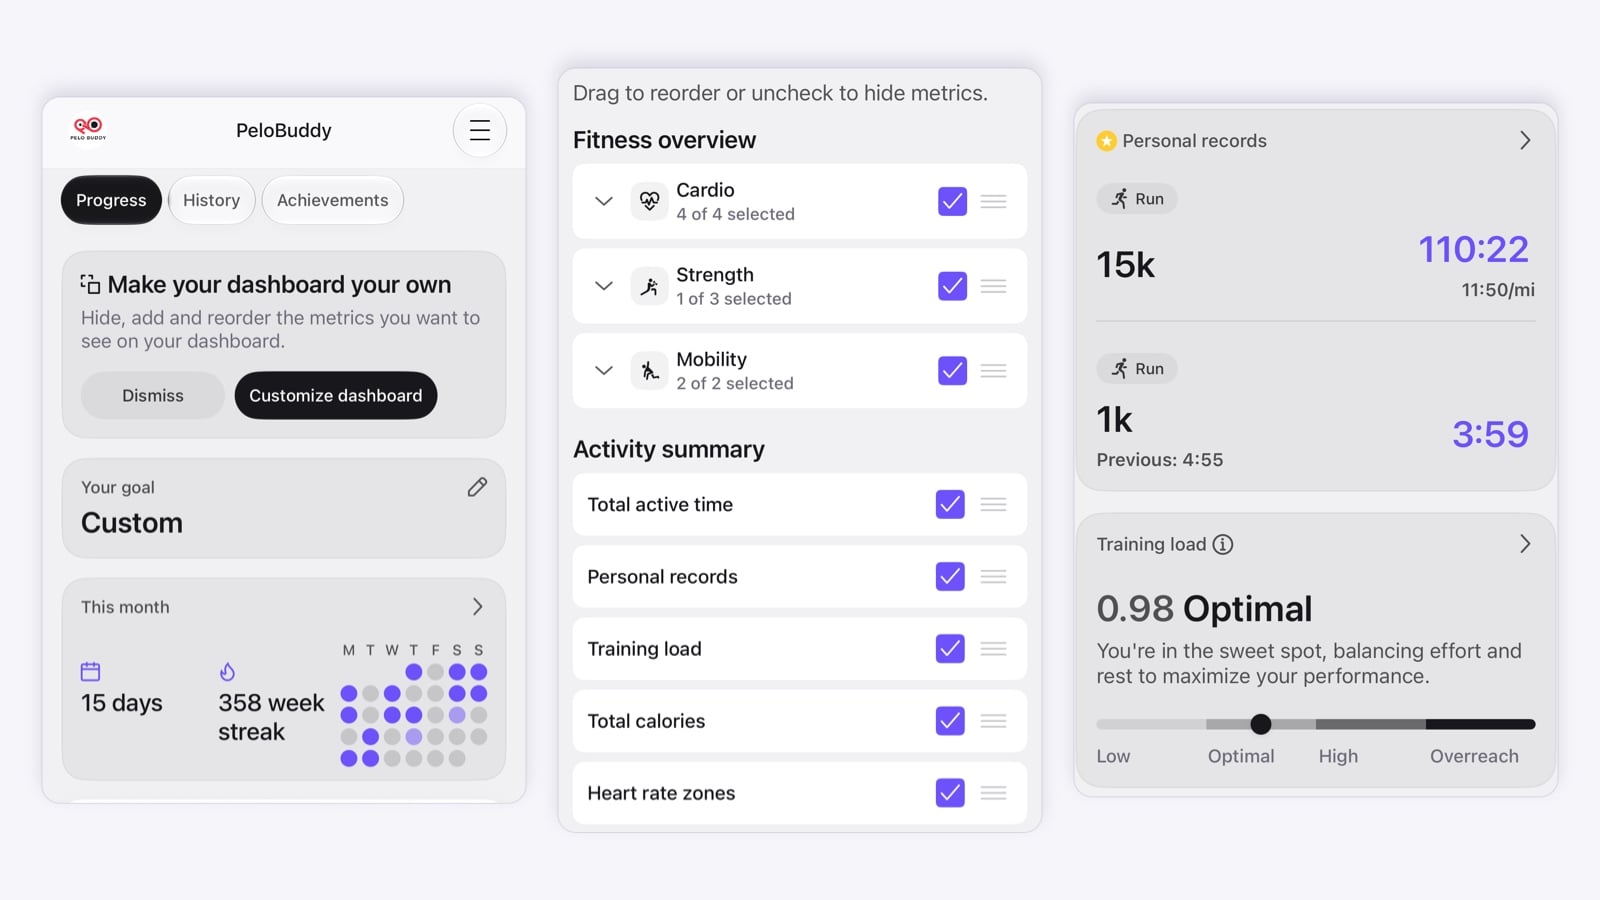
A “Make your dashboard your own” card includes a Customize dashboard button. There are also pencil icons beside the Fitness overview and Activity summary headings.
The customization screen tells members to “Drag to reorder or uncheck to hide metrics.” Each item has a checkbox and a drag handle.
The options shown include the Cardio, Strength, and Mobility categories under Fitness overview. Each category has an expand arrow and a count of selected metrics.
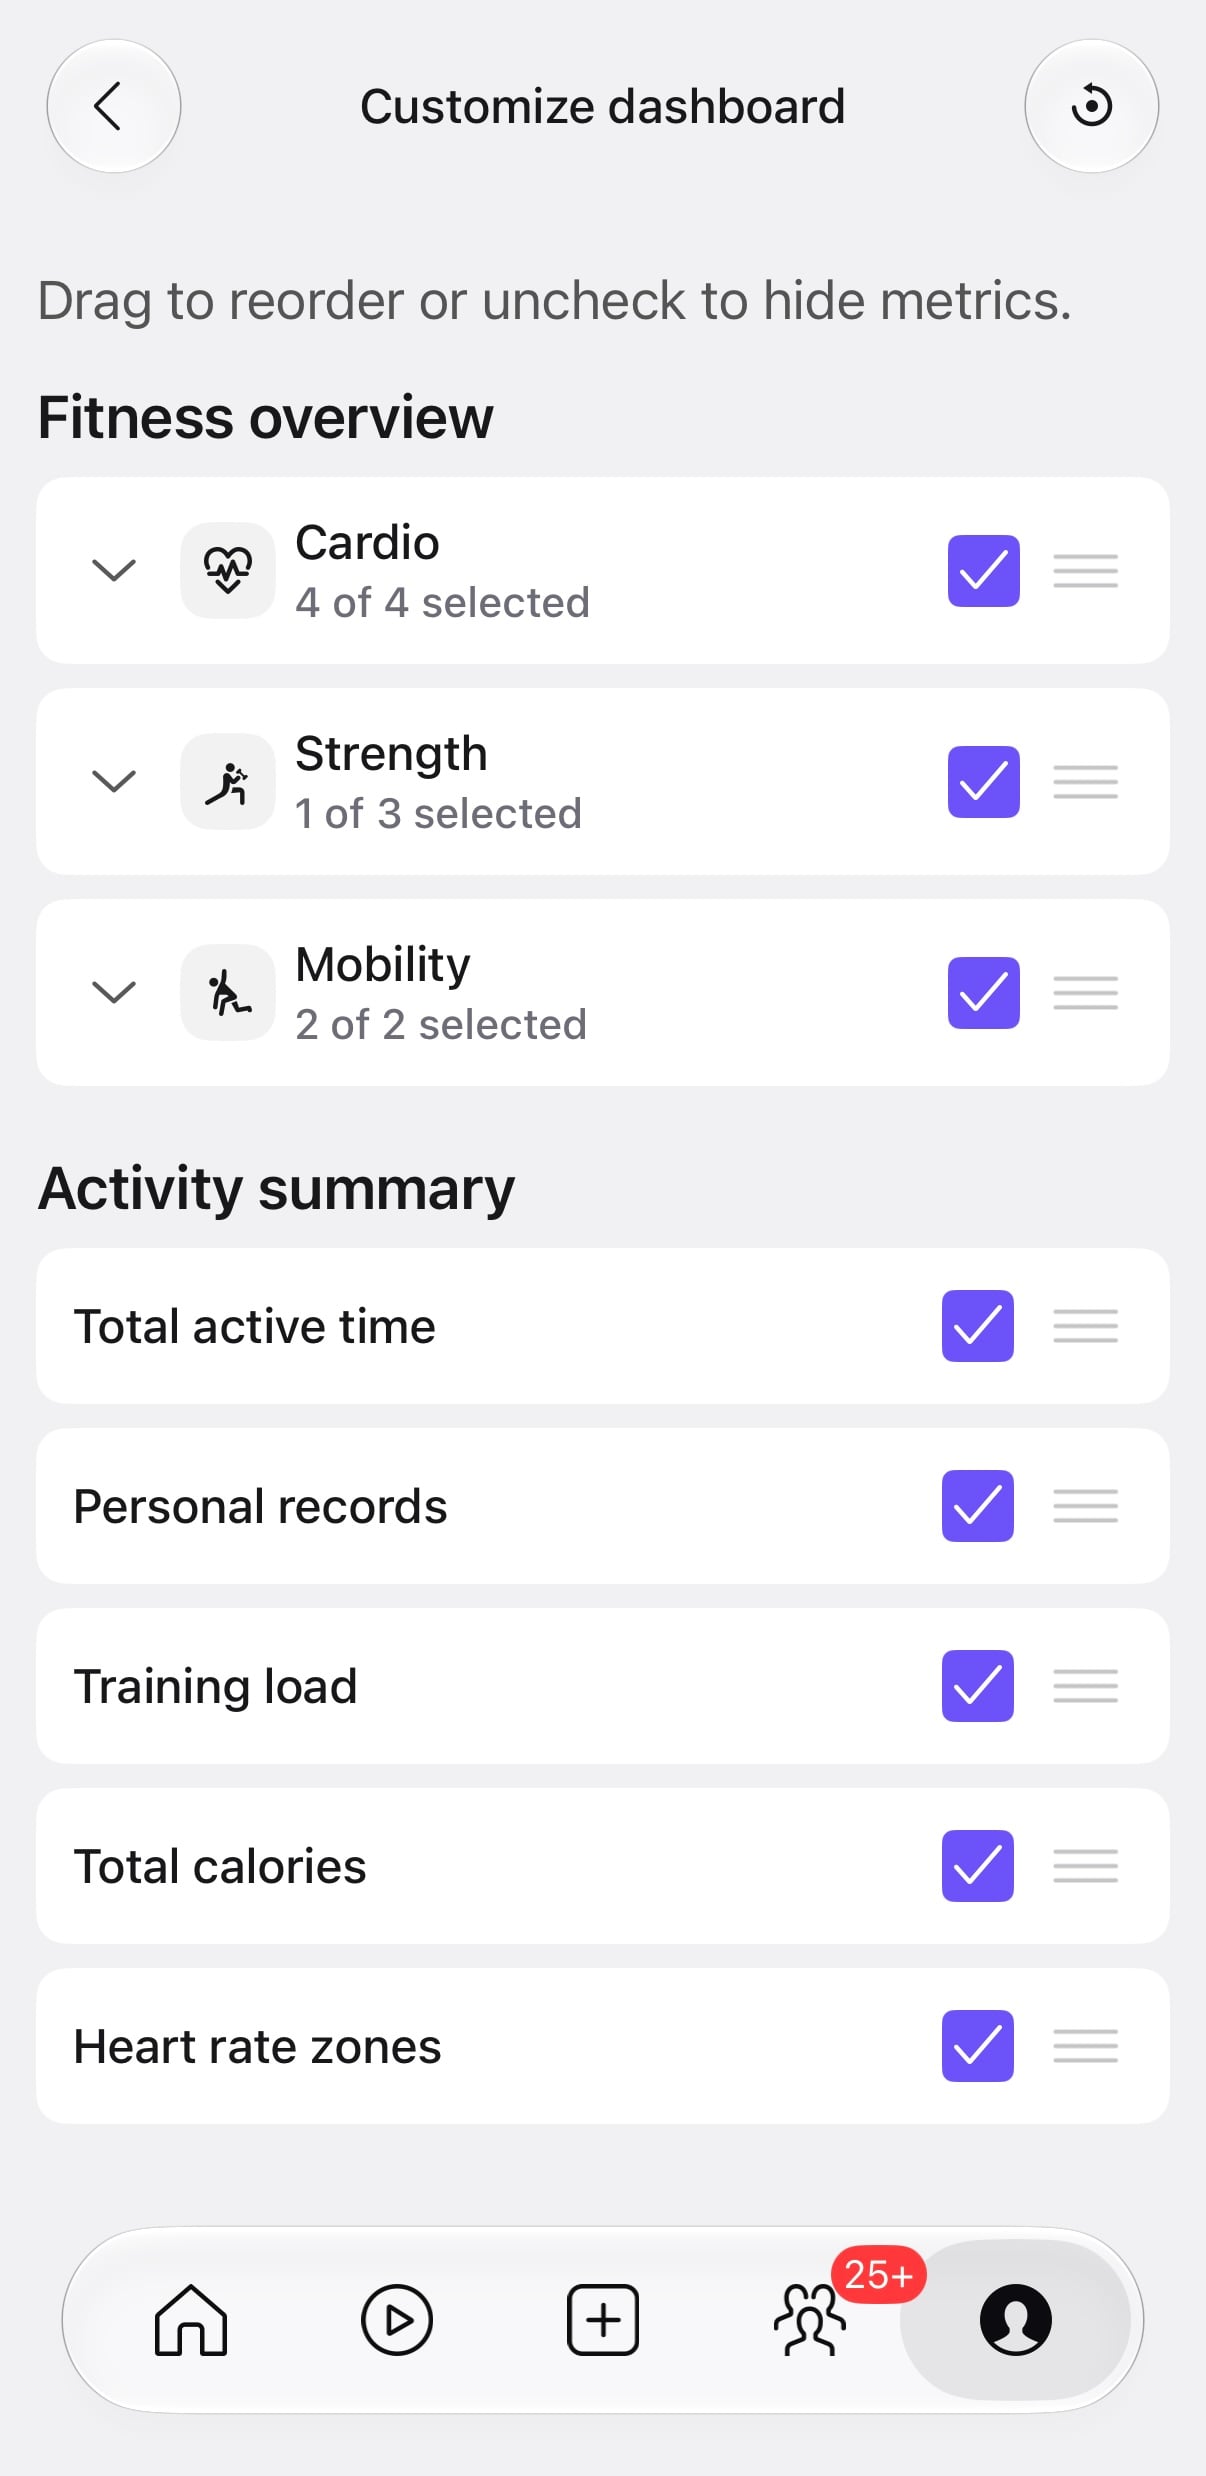
Under Activity summary, the choices shown are Total active time, Personal records, Training load, Total calories, and Heart rate zones. For example, if you would rather see your PRs before your active time, you can change their order. If you don’t want a calorie total on your dashboard, you can uncheck it.
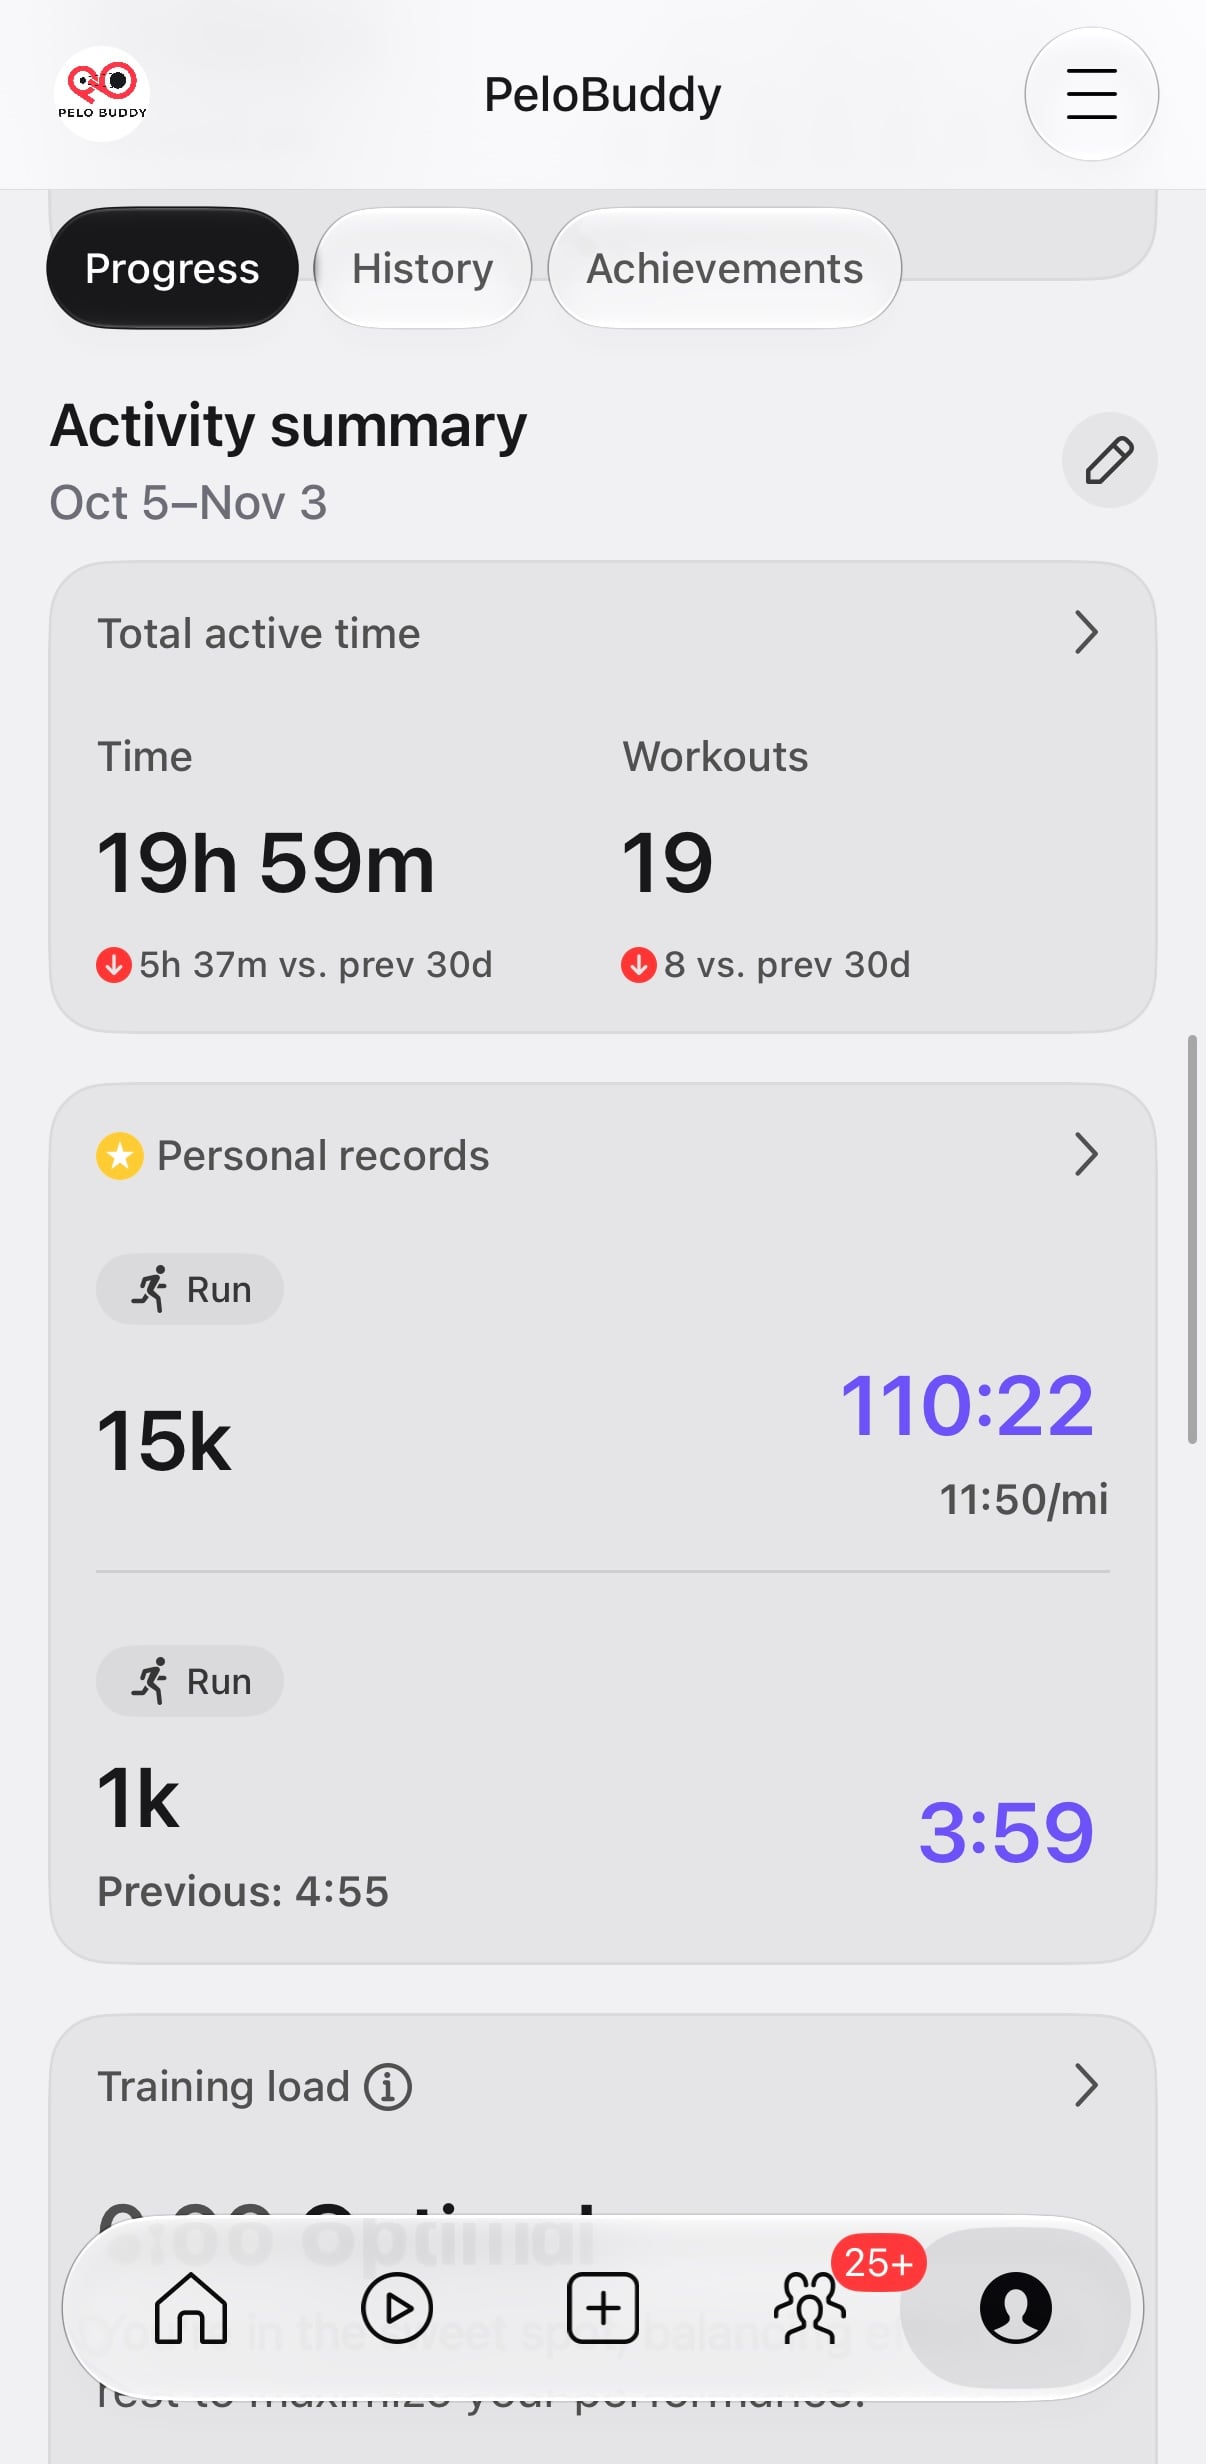
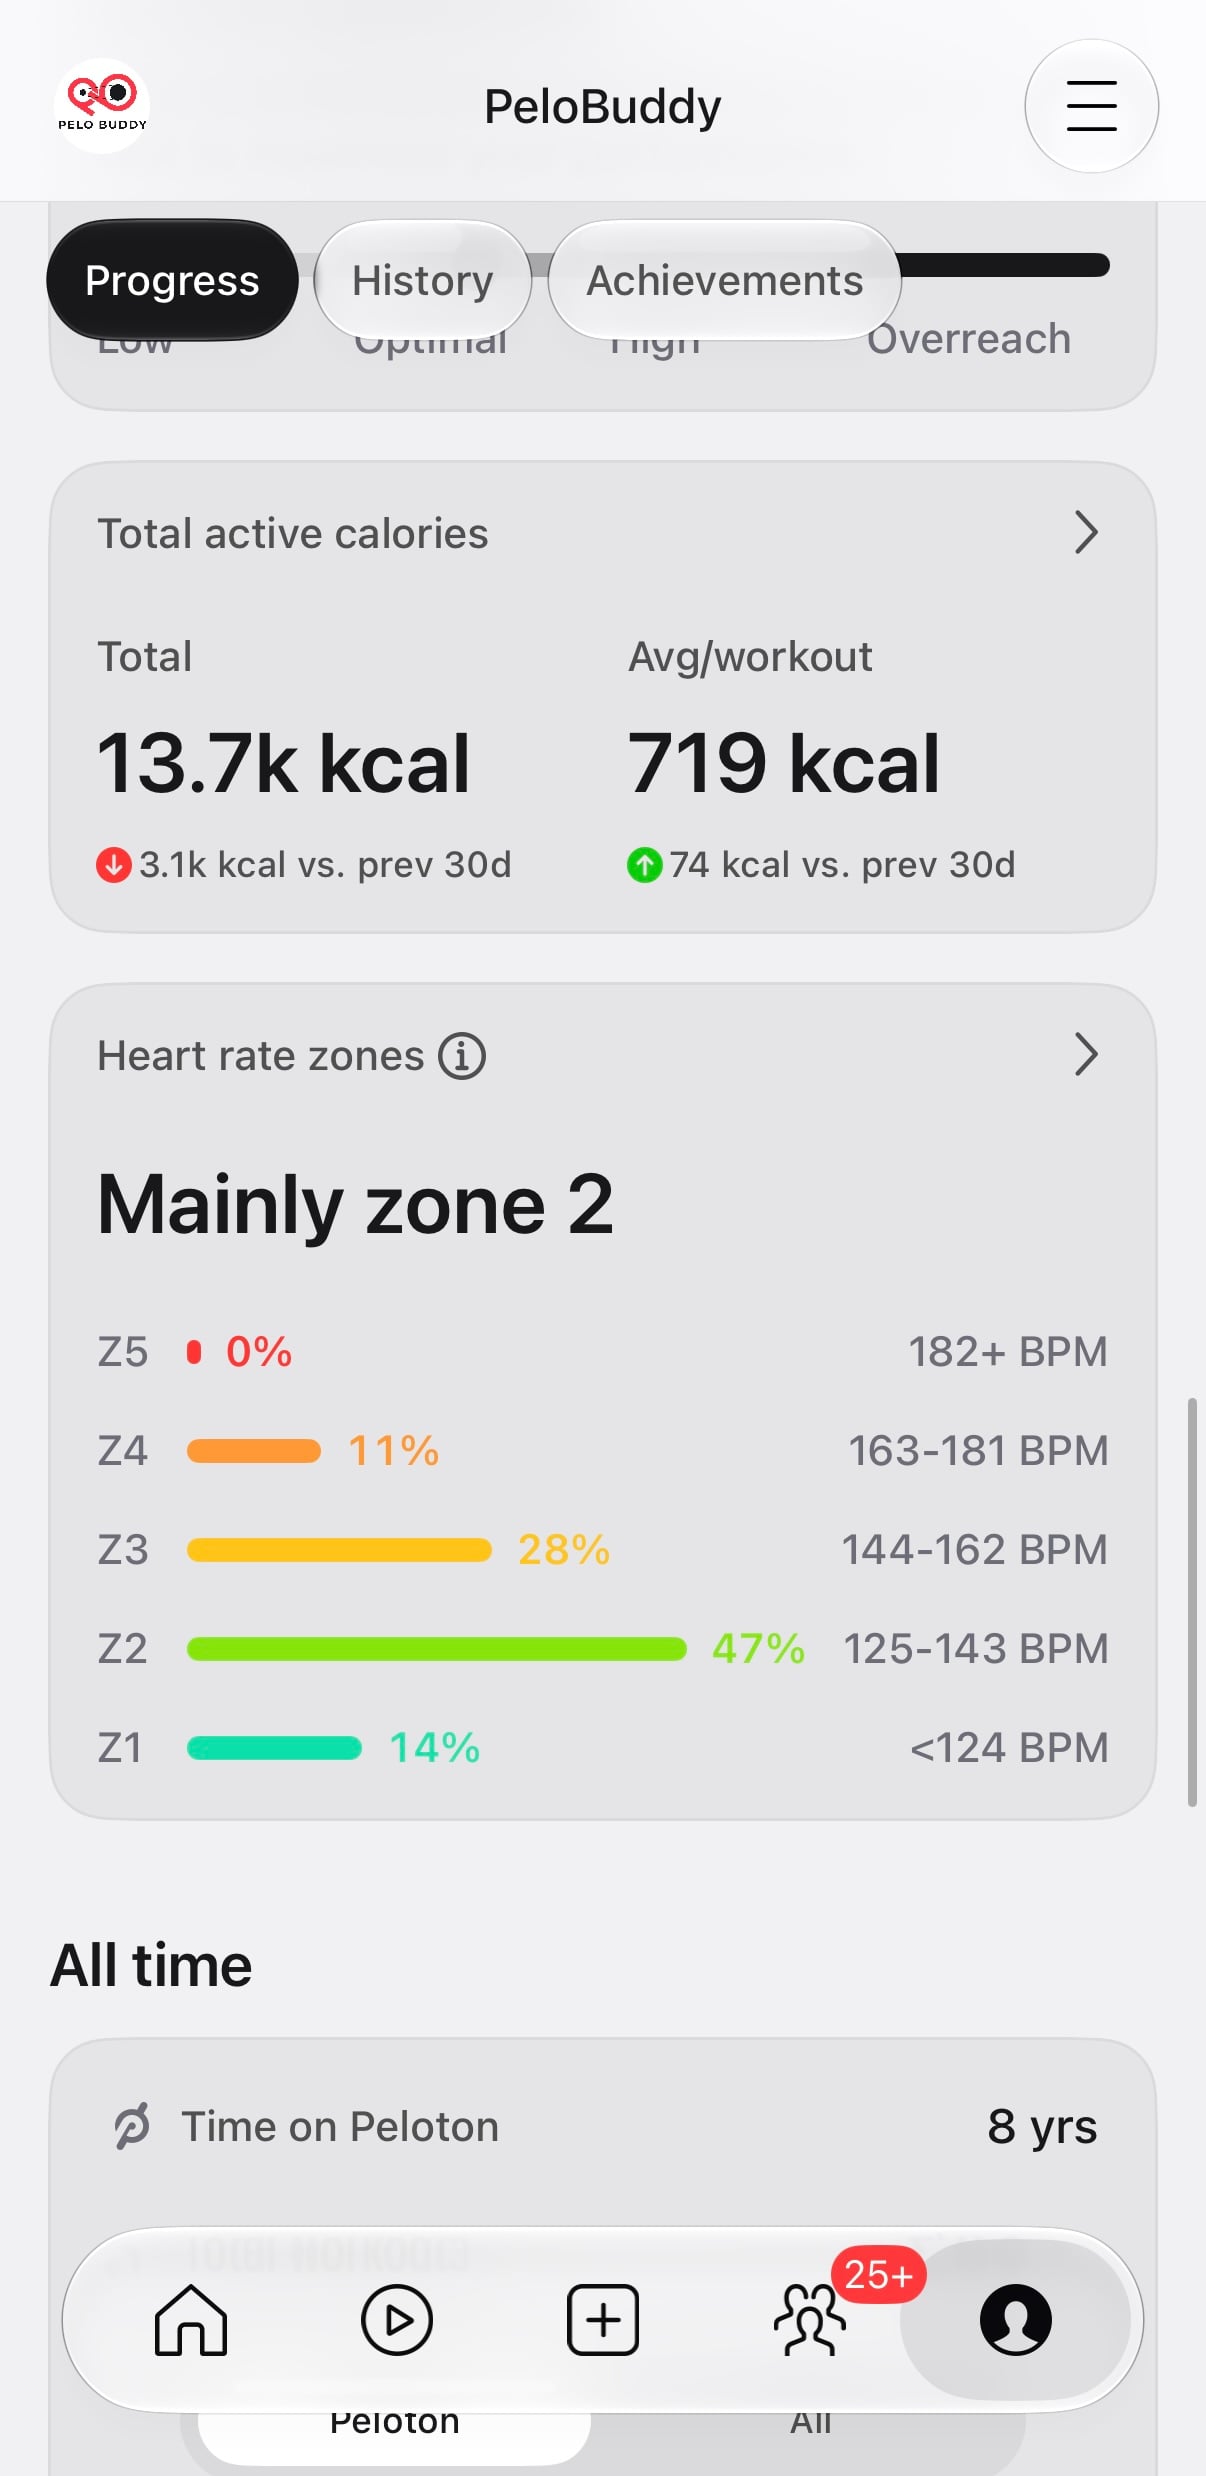
The Activity summary brings together workout totals and performance metrics. Total active time shows both time and workout count, with comparisons to the previous period. The calorie card includes total active calories and an average per workout, also with comparisons.
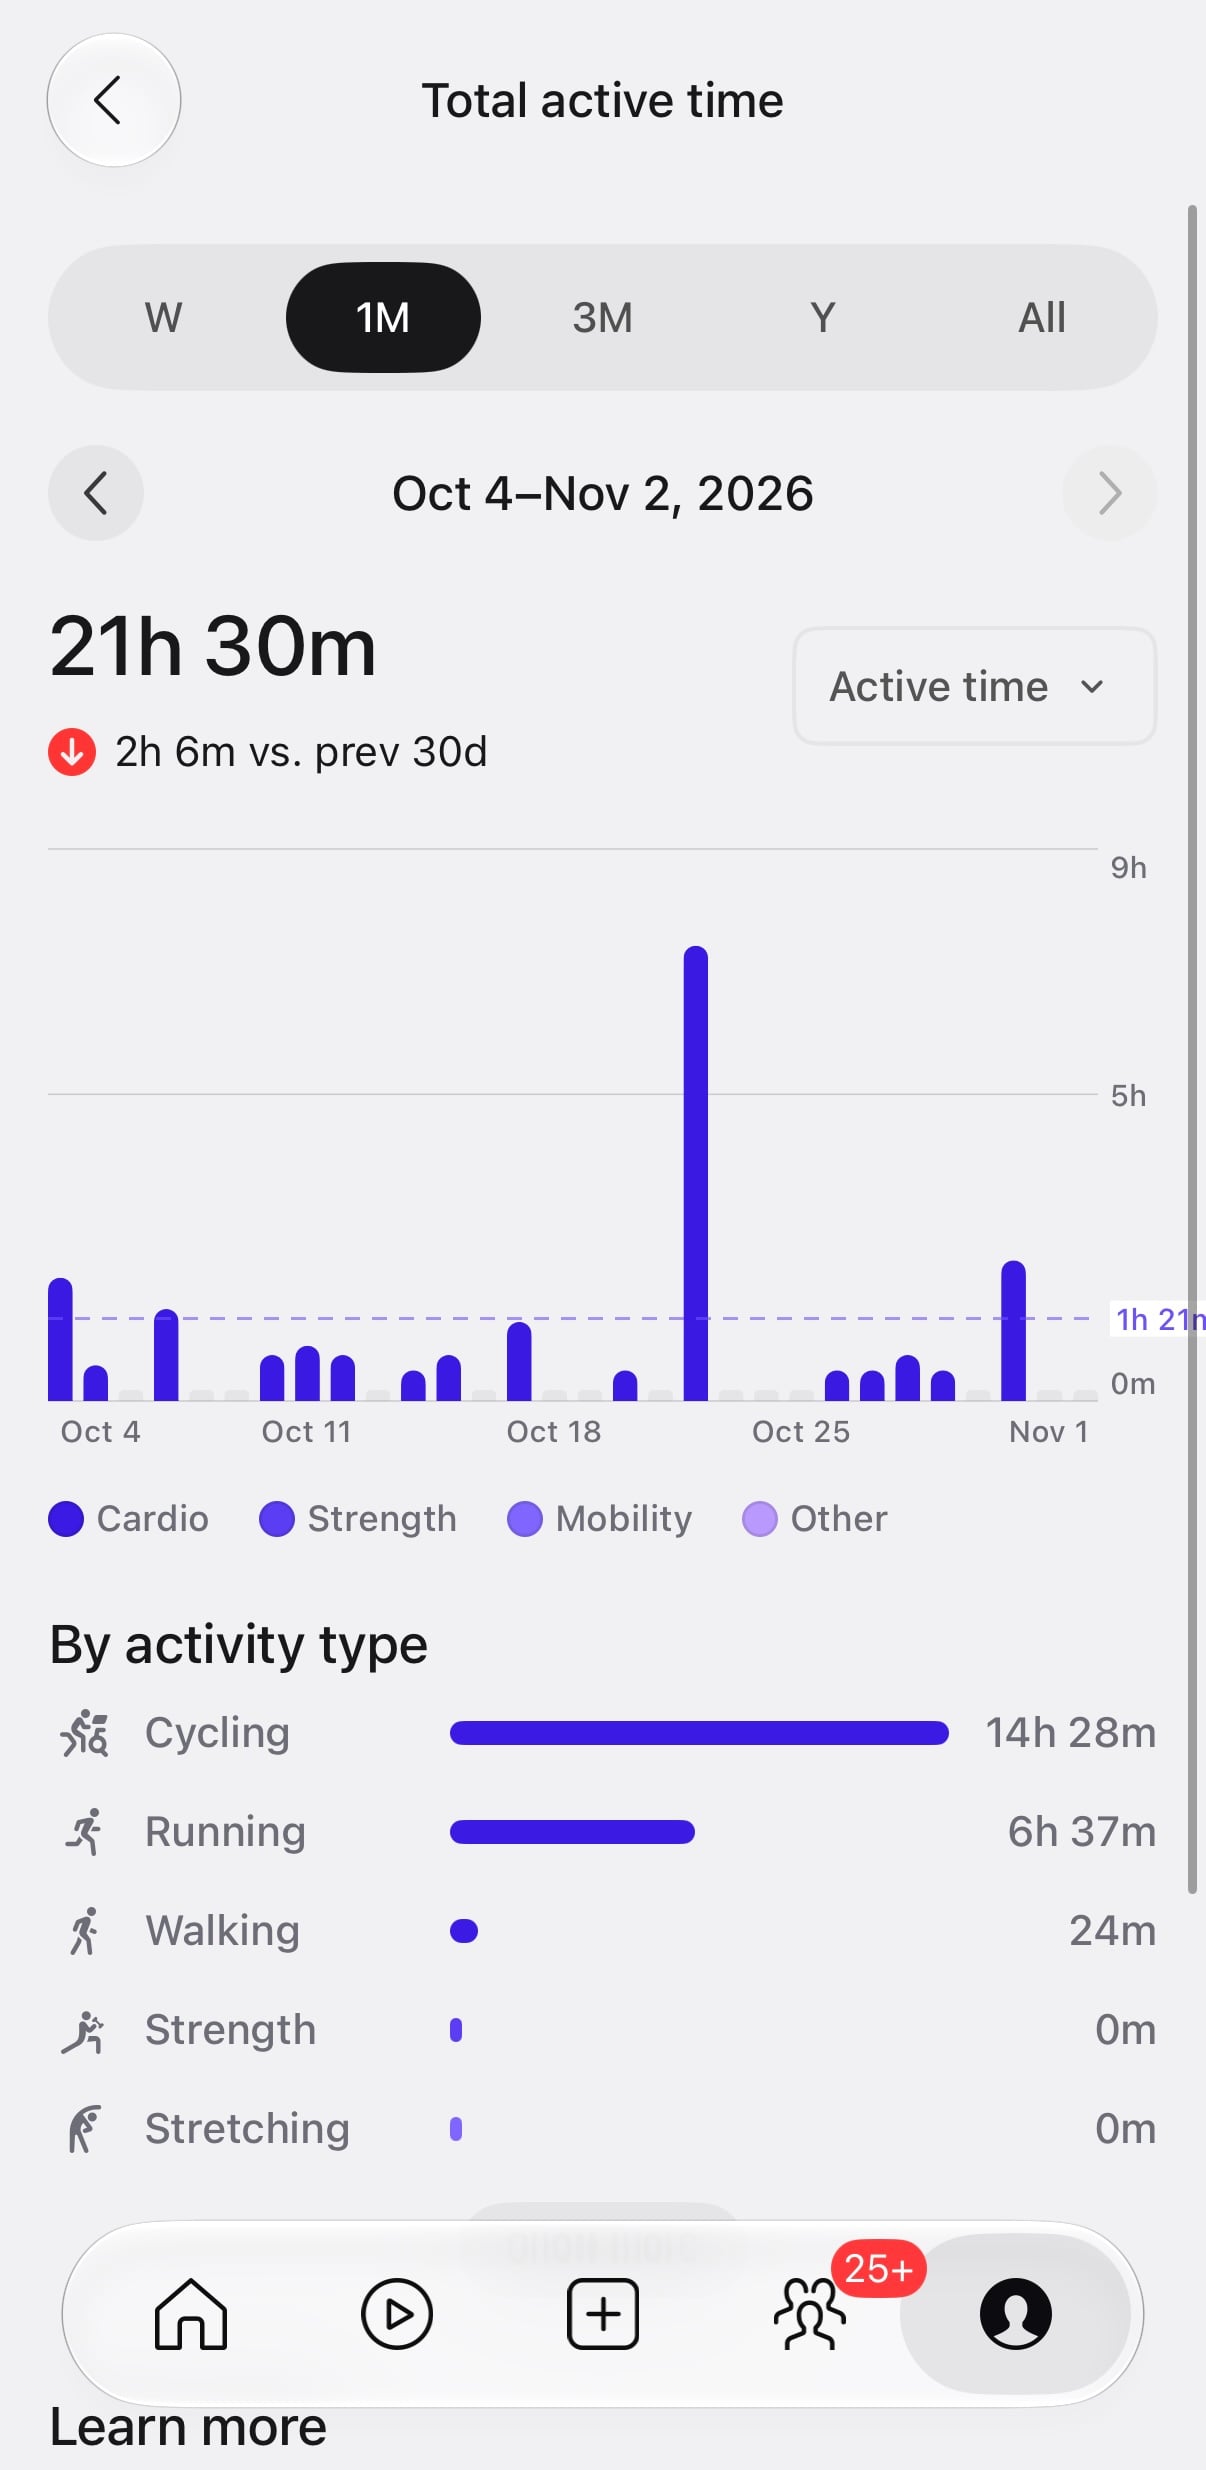
Opening Total active time brings up a more detailed chart. Members can choose a week, one month, three months, a year, or all time, and use arrows to move between periods. The previous active-time view had week, month, year, and all-time options; the three-month option is an addition here.
The old active-time view used a donut chart broken down by workout type. The new view uses a bar chart with a Cardio, Strength, Mobility, and Other legend, while keeping an activity-type breakdown below the chart. The example shown lists time spent cycling, running, and walking, along with other workout types.
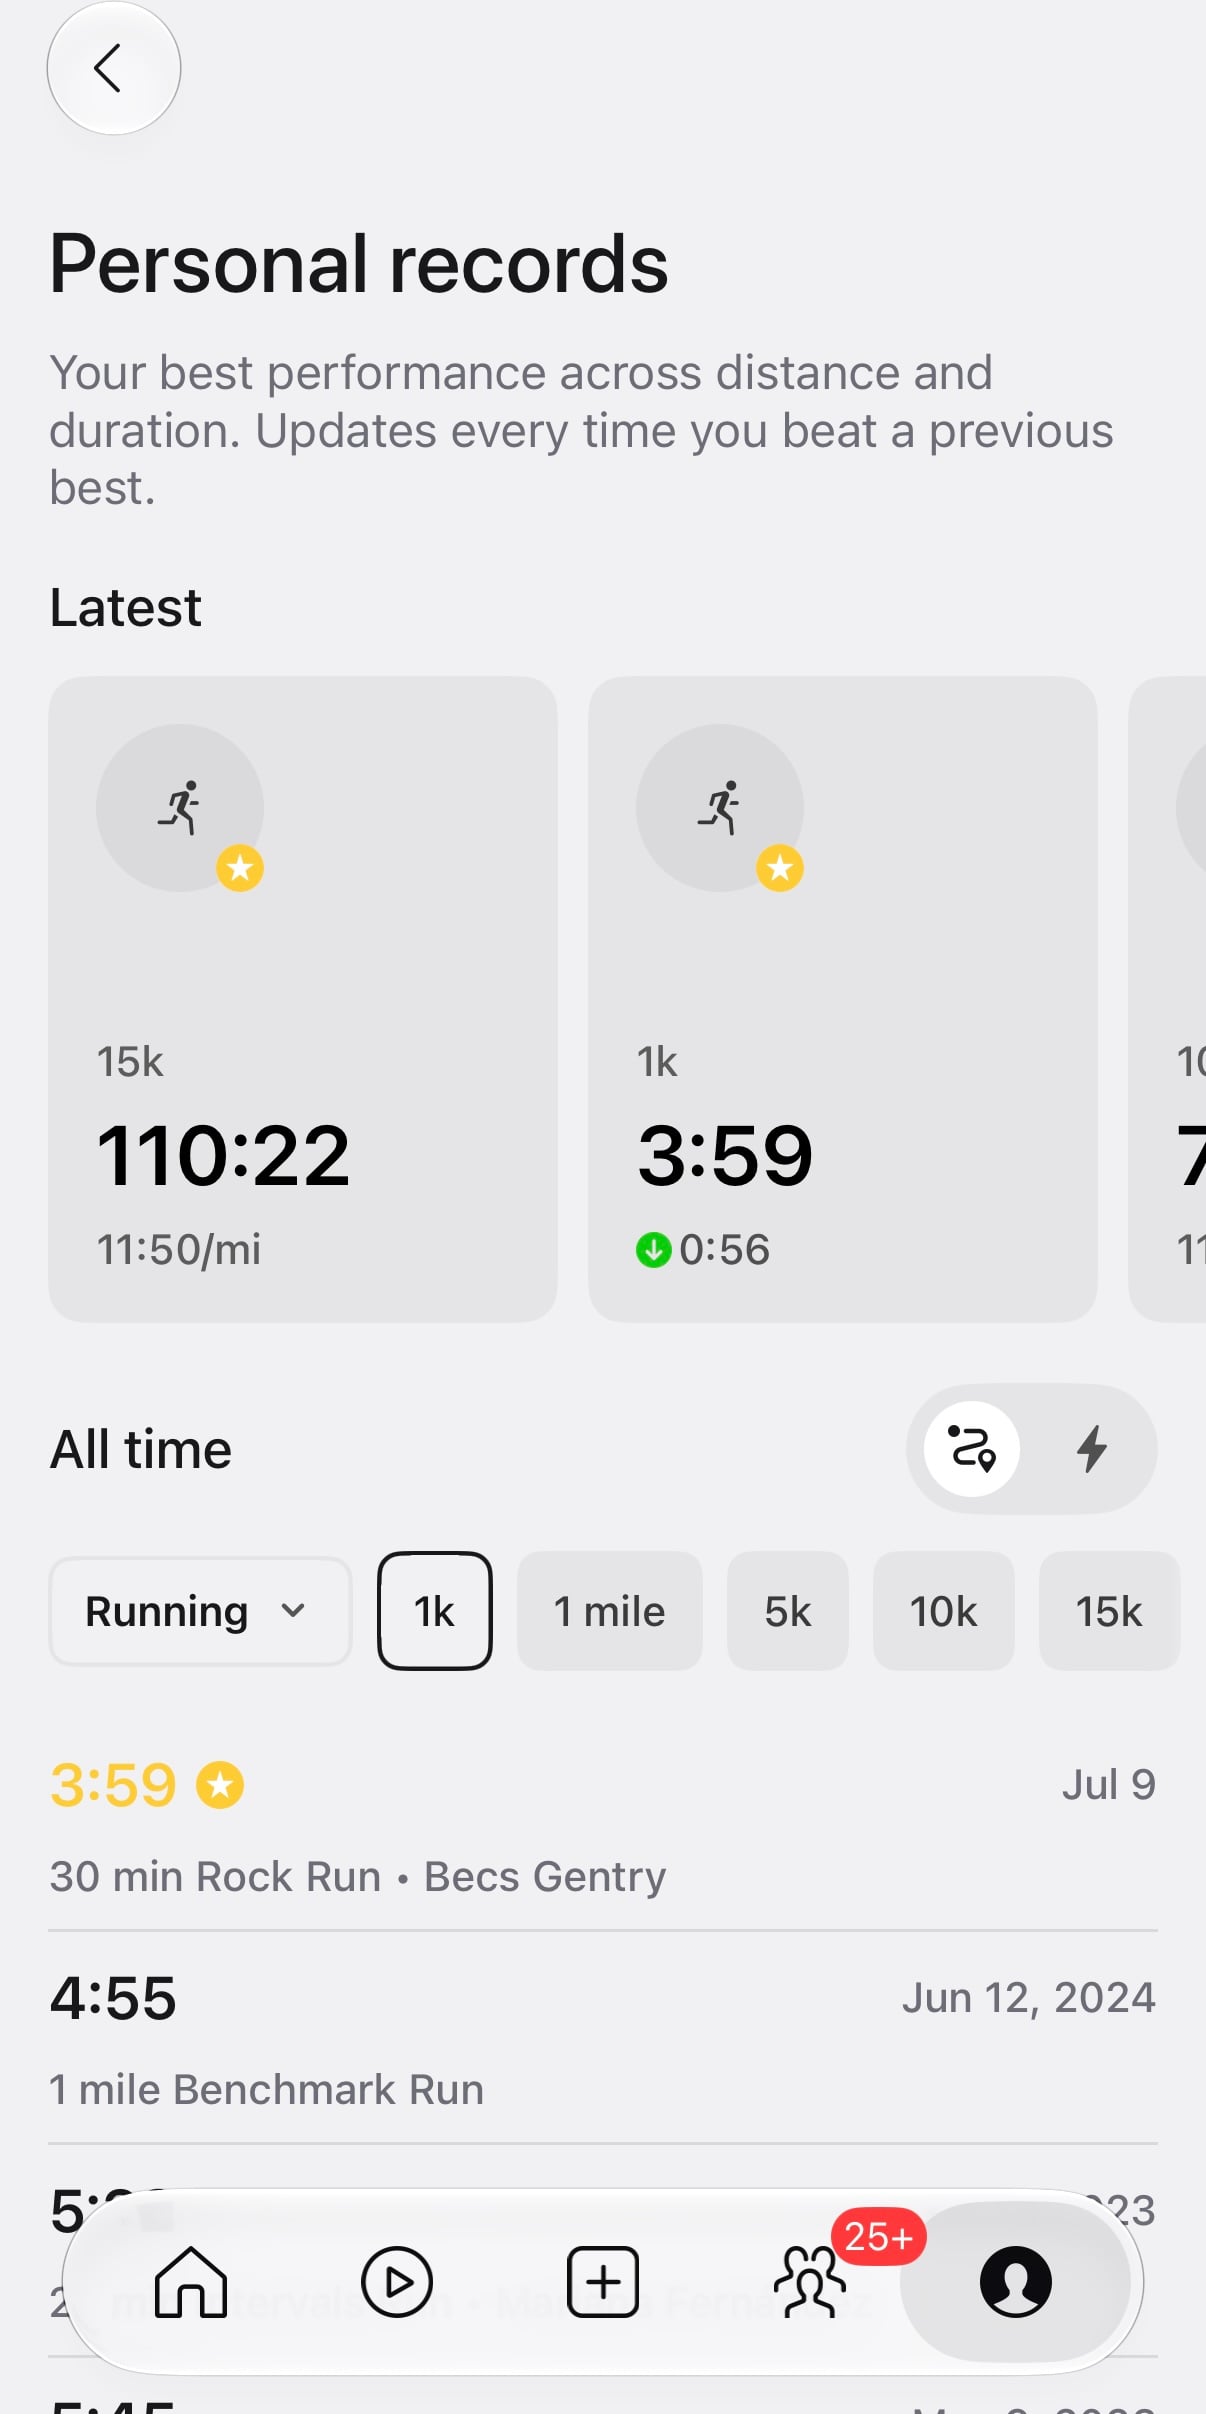
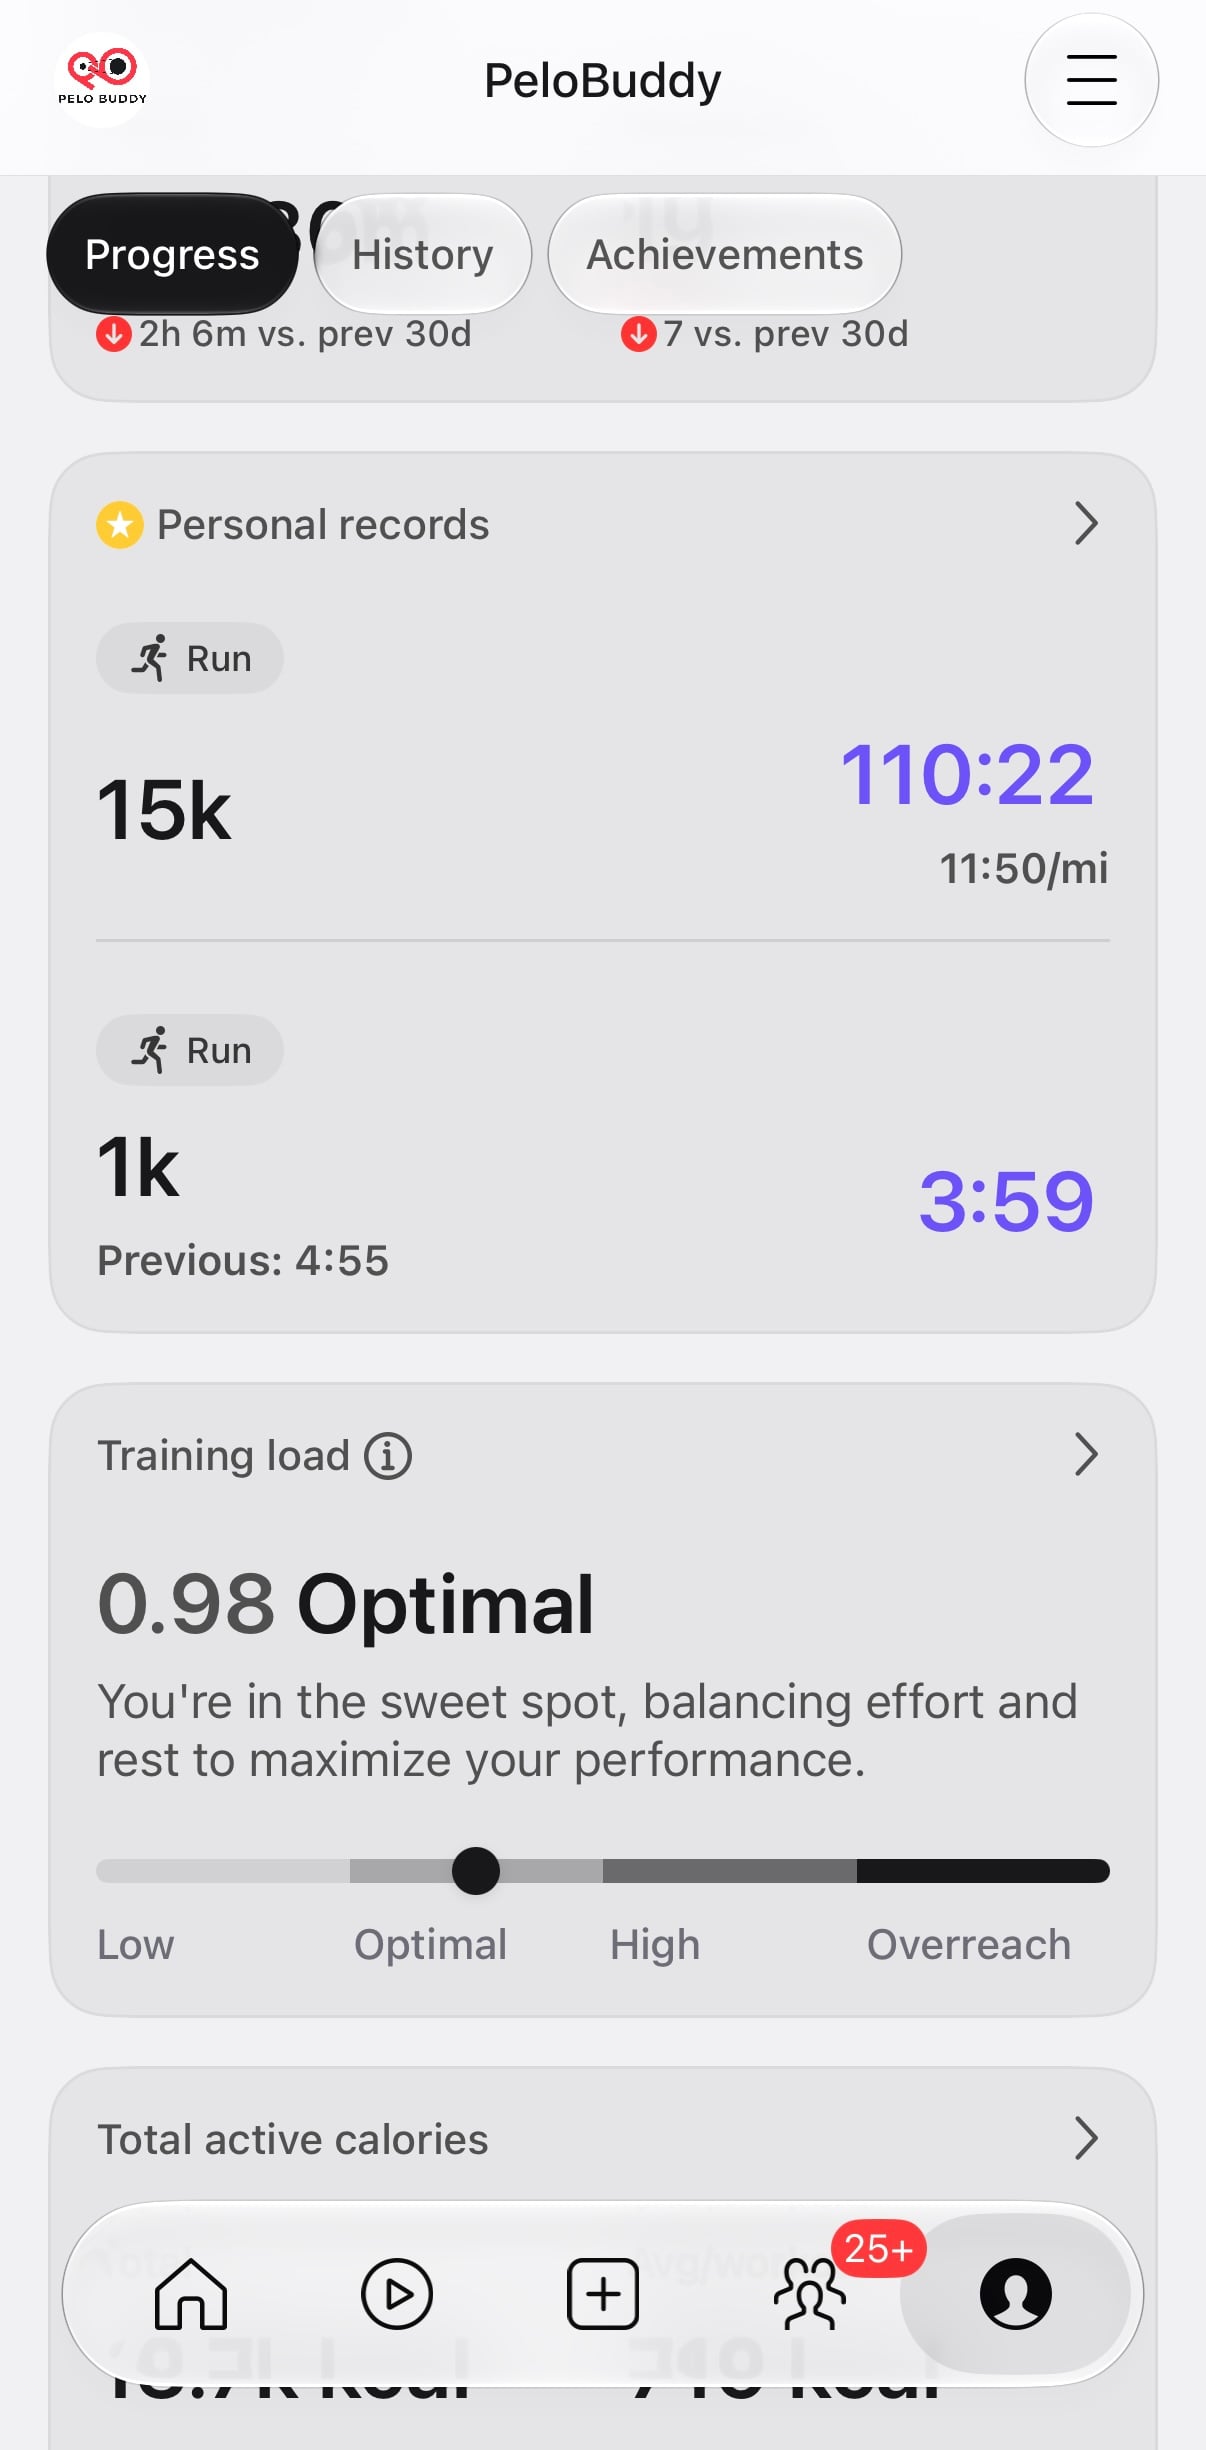
Personal records has its own detail page with recent records and an all-time history. Peloton describes it as tracking your best performances across distance and duration, updating when you beat a previous best.
In the running view shown here, members can select distances including 1K, 1 mile, 5K, 10K, and 15K. Cycling gives options of 5 min, 10 min, 15 min, and so on – the same as you would see on your Bike. The history lists records alongside the date and associated workout, so you can see previous bests as well as the current record. Peloton added distance-based running PRs to web profiles in 2023, when they weren’t viewable in the app. This redesign includes a dedicated PR view within the app dashboard.
The Heart rate zones card shows the share of time spent in each of five zones, along with the corresponding heart-rate ranges. It also summarizes the zone where you spent the most time; the example shown says “Mainly zone 2.”
Members can customize their heart rate zone ranges through their profile, a change introduced alongside Peloton’s Heart Rate Zone Workouts. The BPM ranges in the screenshot are specific to the account shown.
Training Load appears in the Activity summary with a numerical value and one of four labels: Low, Optimal, High, or Overreach. One example in the new dashboard shows 0.98, labeled Optimal.
Peloton explains Training Load as:
“Your training load includes all of your tracked activities on and off Peloton. It measures the physical stress on your body by combining the duration of your workouts with their intensity.”
They go on to describe the four categories as follows:
- Low: “Light effort, best for recovery.”
- Optimal: “Ideal balance to safely build your fitness.”
- High: “Pushing yourself hard. Be sure to prioritize rest.”
- Overreach: “Maxing out. Current routine could cause excessive strain. Consider easing back to support recovery.”
The Training Load page doesn’t give the calculation, time window, or numerical cutoffs for those categories.
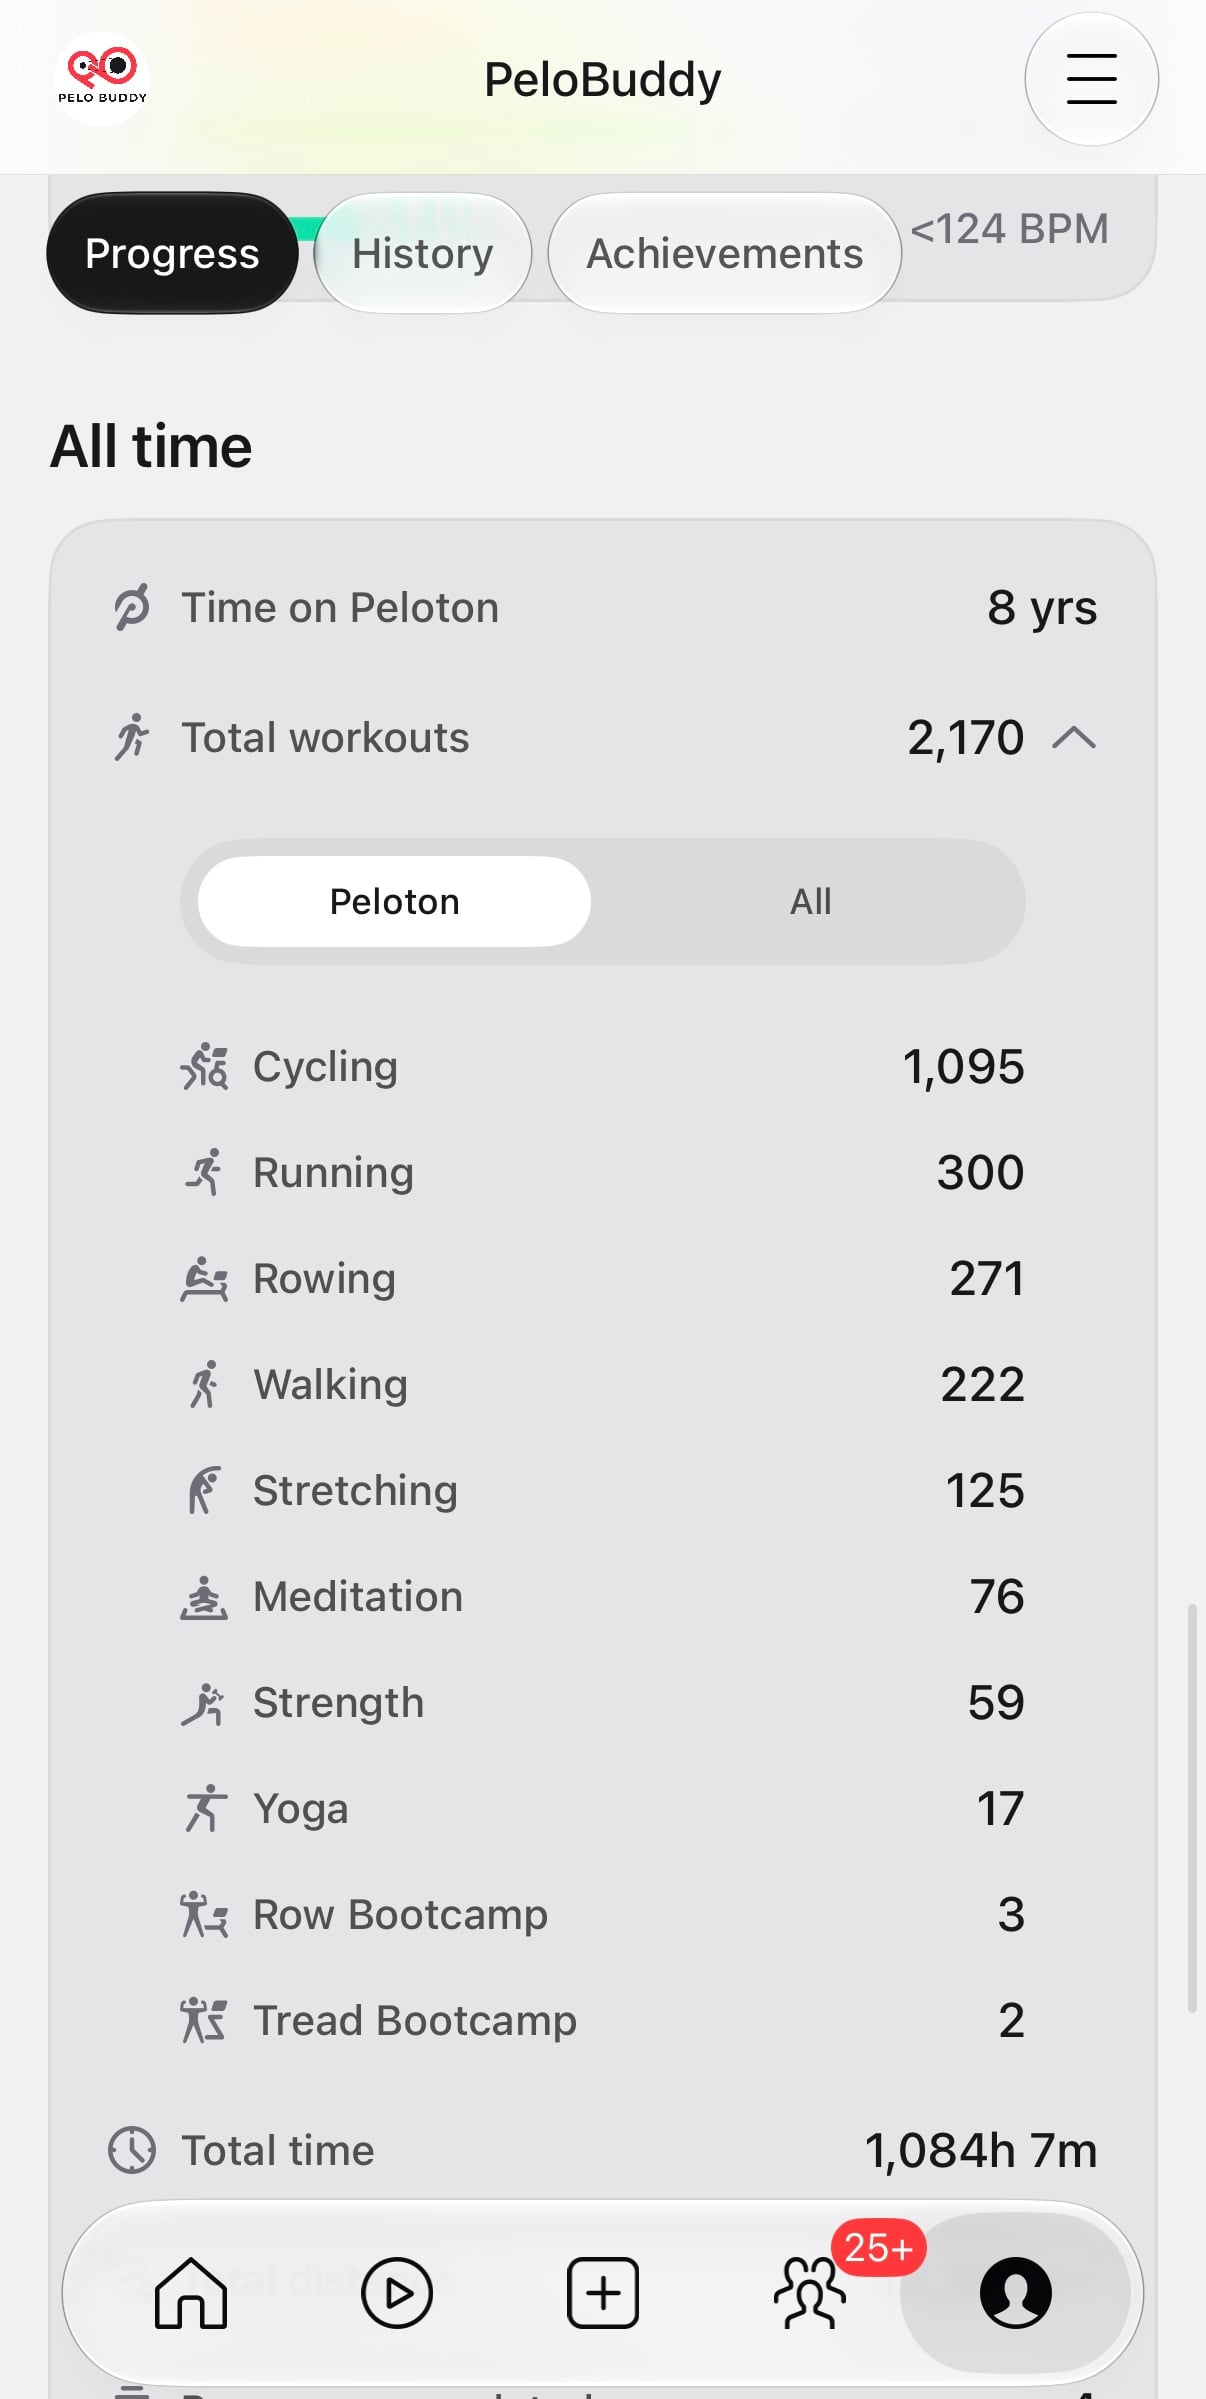
The All time section brings together your time on Peloton, total workouts, total time and distance, programs completed, and the number of instructors you’ve taken.
This is where milestones are now hiding. Pressing “Total workouts” expands your breakdown of workouts per class type, which you can use to see how close you are to milestones. There are toggles for “All” and “Peloton” (members keeping track of their milestones will be interested in the “Peloton” number). In the old layout, this information was much more visible and easier to find.
Peloton has a note at the bottom that metrics, insights, and recommendations include data from connected apps. The account shown here lists Apple Health, Garmin Connect, and WHOOP, along with a Manage apps button. This should be custom to which apps you’ve actually connected to your account.
Some information from the previous dashboard isn’t visible in the new dashboard shown here, including the Body Activity muscle map and the 30-day Strive Score total.
What do you think of the new profile, and which metrics would you keep on your dashboard?
Support the site! Enjoy the news & guides we provide? Help us keep bringing you the news. Pelo Buddy is completely free, but you can help support the site with a one-time or monthly donation that will go to our writers, editors, and more. Find out more details here.
Get Our Newsletter Want to be sure to never miss any Peloton news? Sign up for our newsletter and get all the latest Peloton updates & Peloton rumors sent directly to your inbox.

Leave a Reply