
Peloton is adding a new way for people to track their performance over time, as well as to help figure out what their difficulty level should be for pace target classes on both the Peloton Tread / Tread+ and Peloton Row. This addition comes one week after Pace target running classes officially launched on Tread.
This is being done with the addition of new Peloton benchmark test classes – currently only available on the Peloton Tread, Peloton Tread+, and Peloton Row hardware devices.
This is only available for the Tread family & Row family of devices – not the Bike. This is likely due to the fact that those who are interested in tracking their performance over time on the Bike are taking advantage of Peloton’s power zone classes and FTP tests – which is a 20 minute performance test on the bike.
The benchmark tests on both the Peloton Row & Peloton Tread are distance based. Runners will use a brand new 1 mile benchmark running test. Rowers will use a 2k benchmark row test. The goal with both of these is to cover the distance as quickly as possible.
Members will be able to track and compare their performances in the benchmark tests over time. There is a new popup screen when the benchmark test is done that shows you how you performed compared to your past tests. At this time, there does not appear to be a way to get back to that screen once the test is over and you’ve clicked out of the test – so be sure to take a picture of it if you want to reference it again.
It is likely that a future software update will allow you to view that benchmark comparison graph again from your workout history somewhere, at any time.
Peloton is giving the general recommendation that these tests be repeated about every 2 months.
The overall functionality of the benchmark tests is nearly identical on both the row benchmark test & run benchmark test – with the main difference being the distance is tracked in different units (miles vs meters).
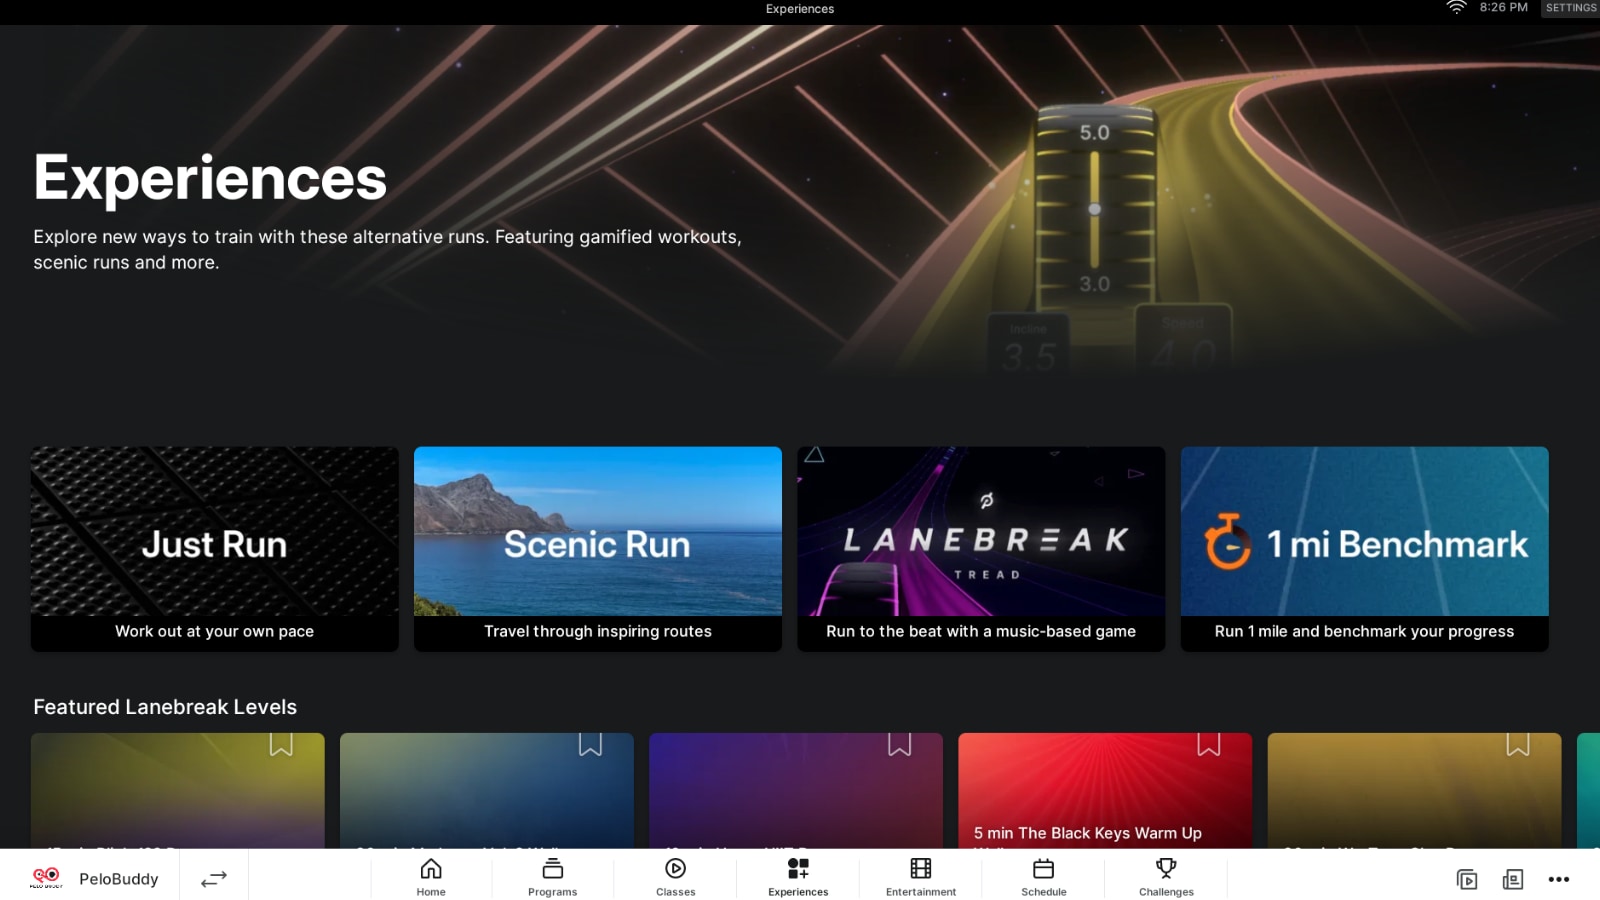
You can find Peloton’s benchmark tests in the “Experiences” section of the tablet (which was recently redesigned to also house scenic rides, Entertainment, and more). There, you should see a new tile for “Benchmark”
One major thing to know ahead of time is that there is no music at all in a Benchmark test. There is no pre-set playlist, there is no option to use Peloton radio, or any other music option. So if you want some music while you take this test, you will need to play it from your phone or some external sound system.
You’ll be presented with a splash screen before you begin the test. Peloton does recommend that those on the Tread set your incline to 1 (similar to how many coaches will keep their incline at 0.5 even on a flat road to simulate the outdoors better).
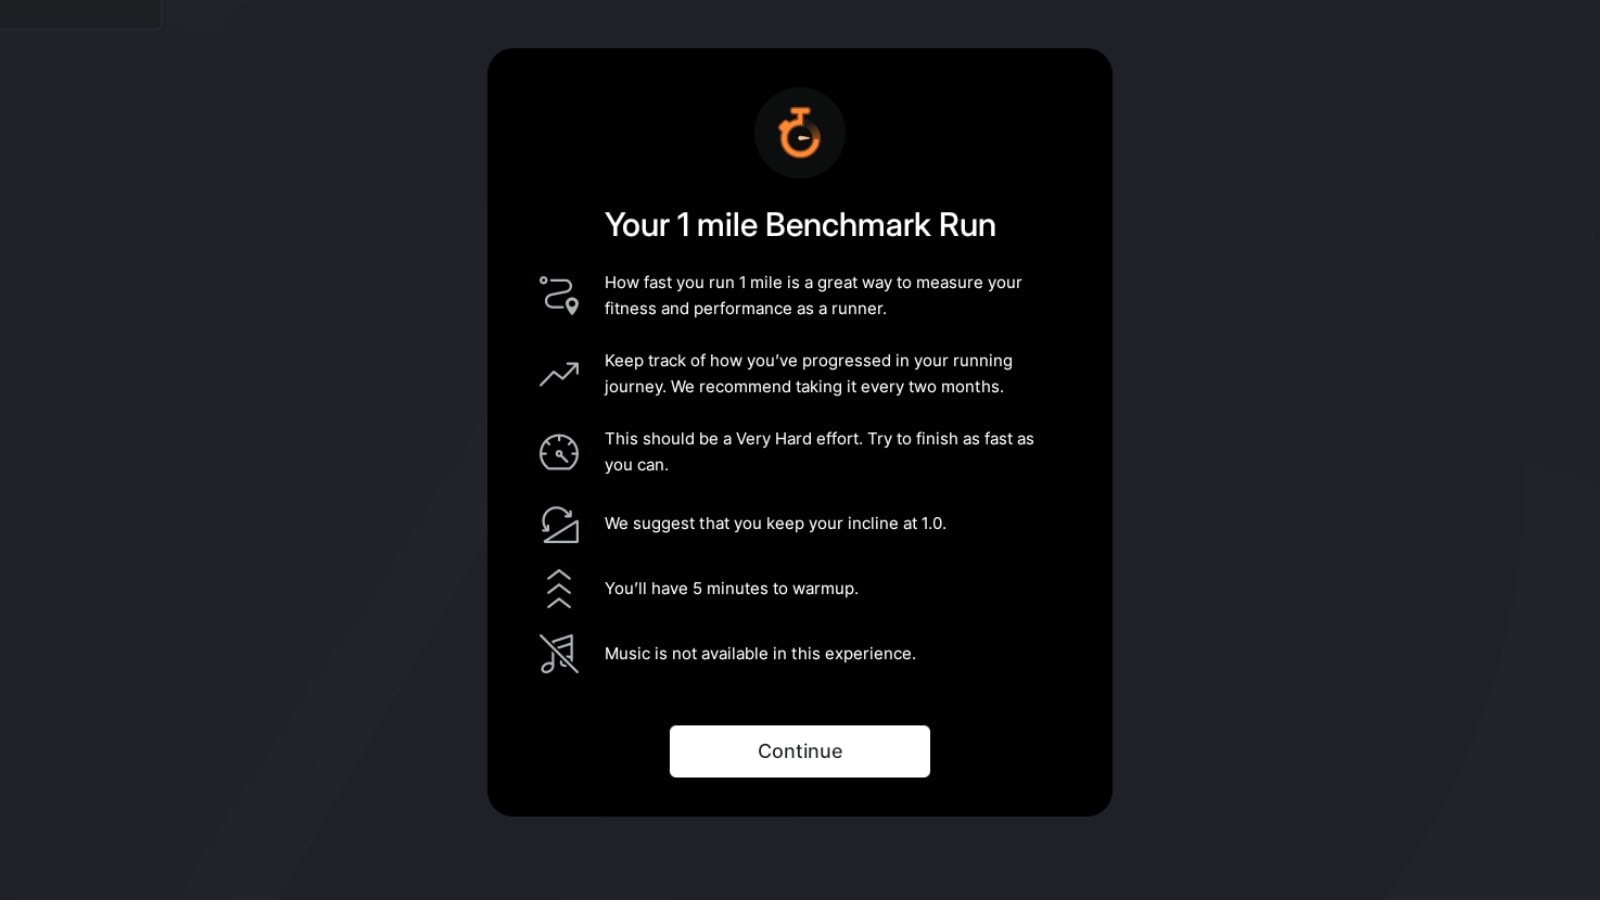
On the run, the screen simply tells you to run at a “Very hard” effort, and to finish as fast as you can. On the Row, it notes that it should be a “Challenging” effort – and for someone at level 5, they should aim to finish in under 8:18.
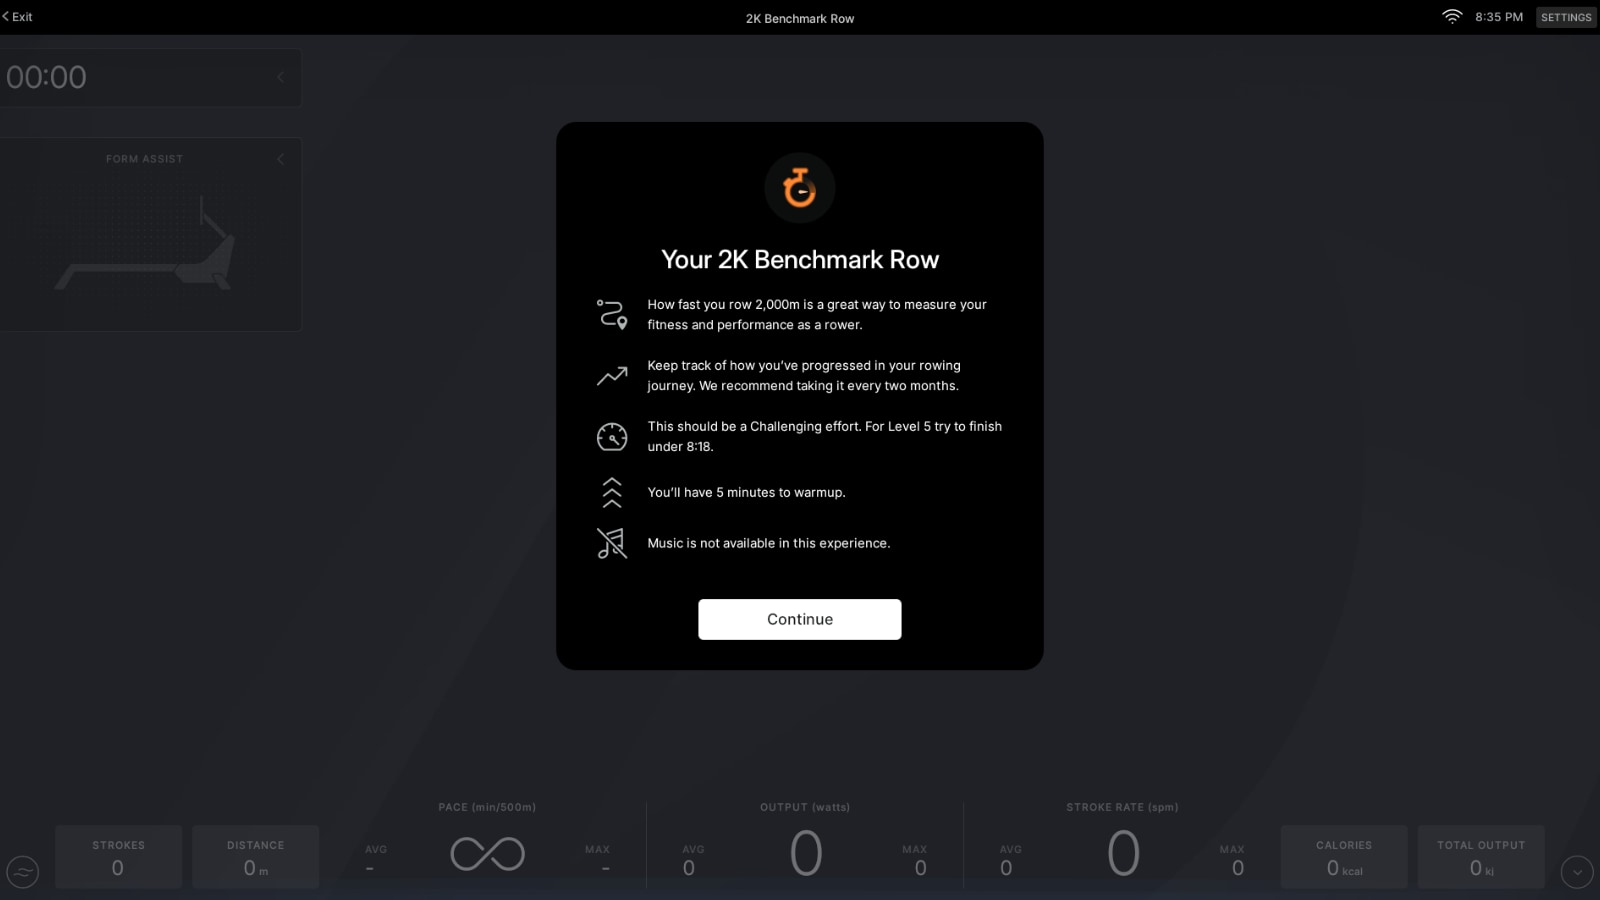
However, even though it uses pace target terminology (both “Very hard” and “challenging” are effort levels coaches teach at in pace target classes), your current pace targets, and the pace target bar, are not shown while the test is in progress.
Once you get past the splash screen, you are presented with the regular final popup with a “Start” button to begin the class. Here you can also connect a heart rate monitor or headphones (although, again, there is no option for music).
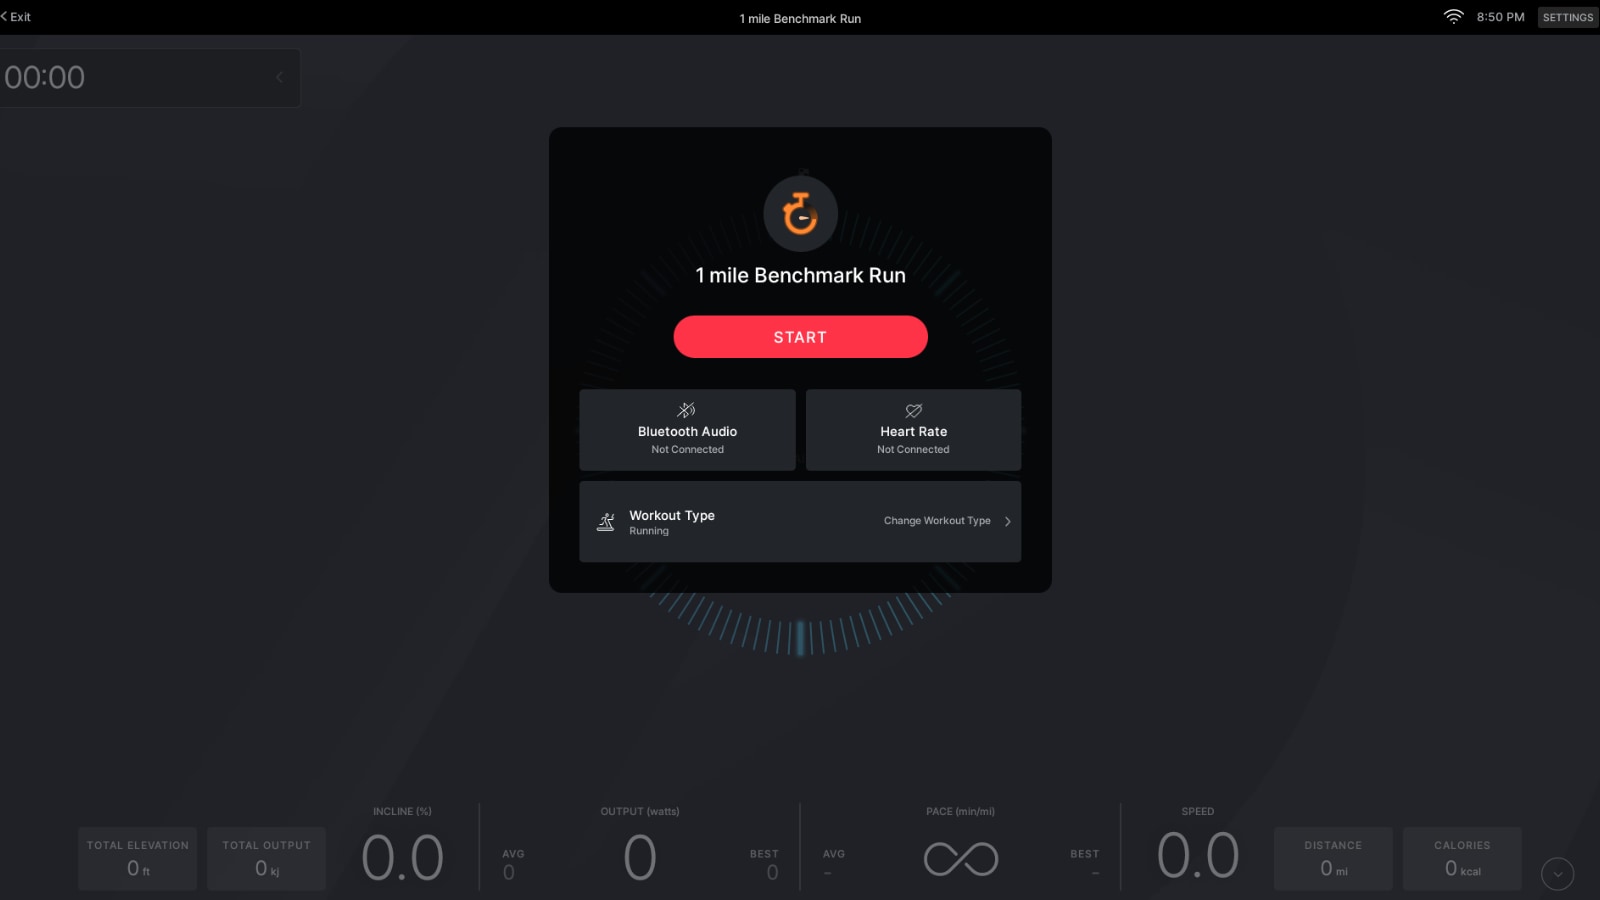
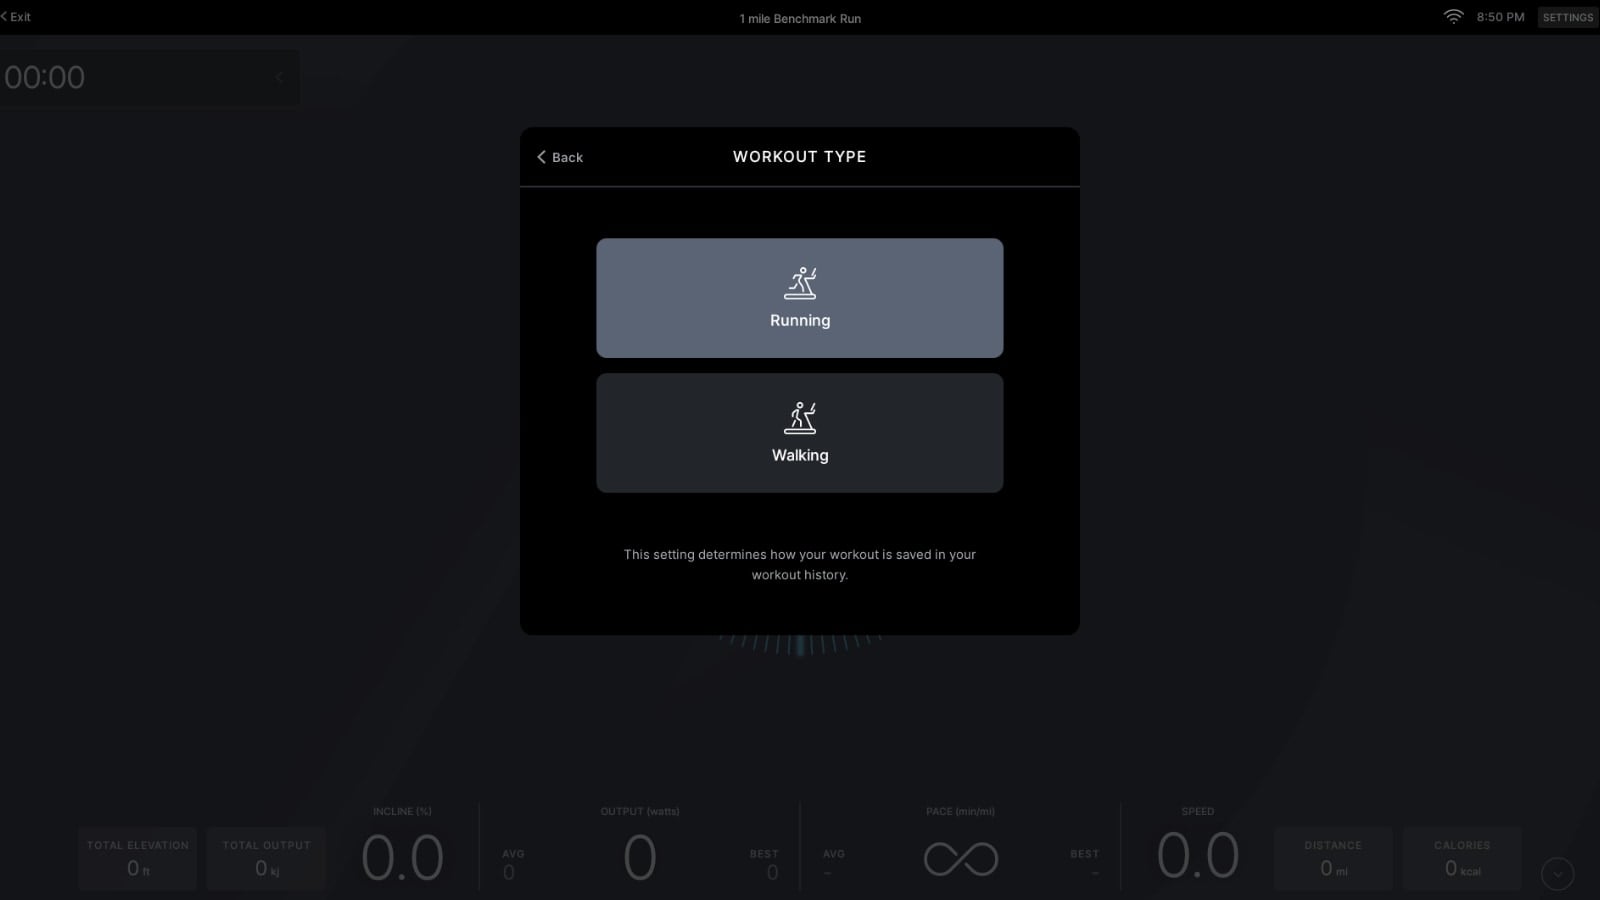
On the Tread, if you wish, you have the choice to have the benchmark test saved as either a Walk, or as a Run.
The benchmark test begins with an optional 5 minute warmup. The screen will show the distance you cover during this warmup, but it is not saved to your completed workout once completed (this would make it hard to compare to previous performances).
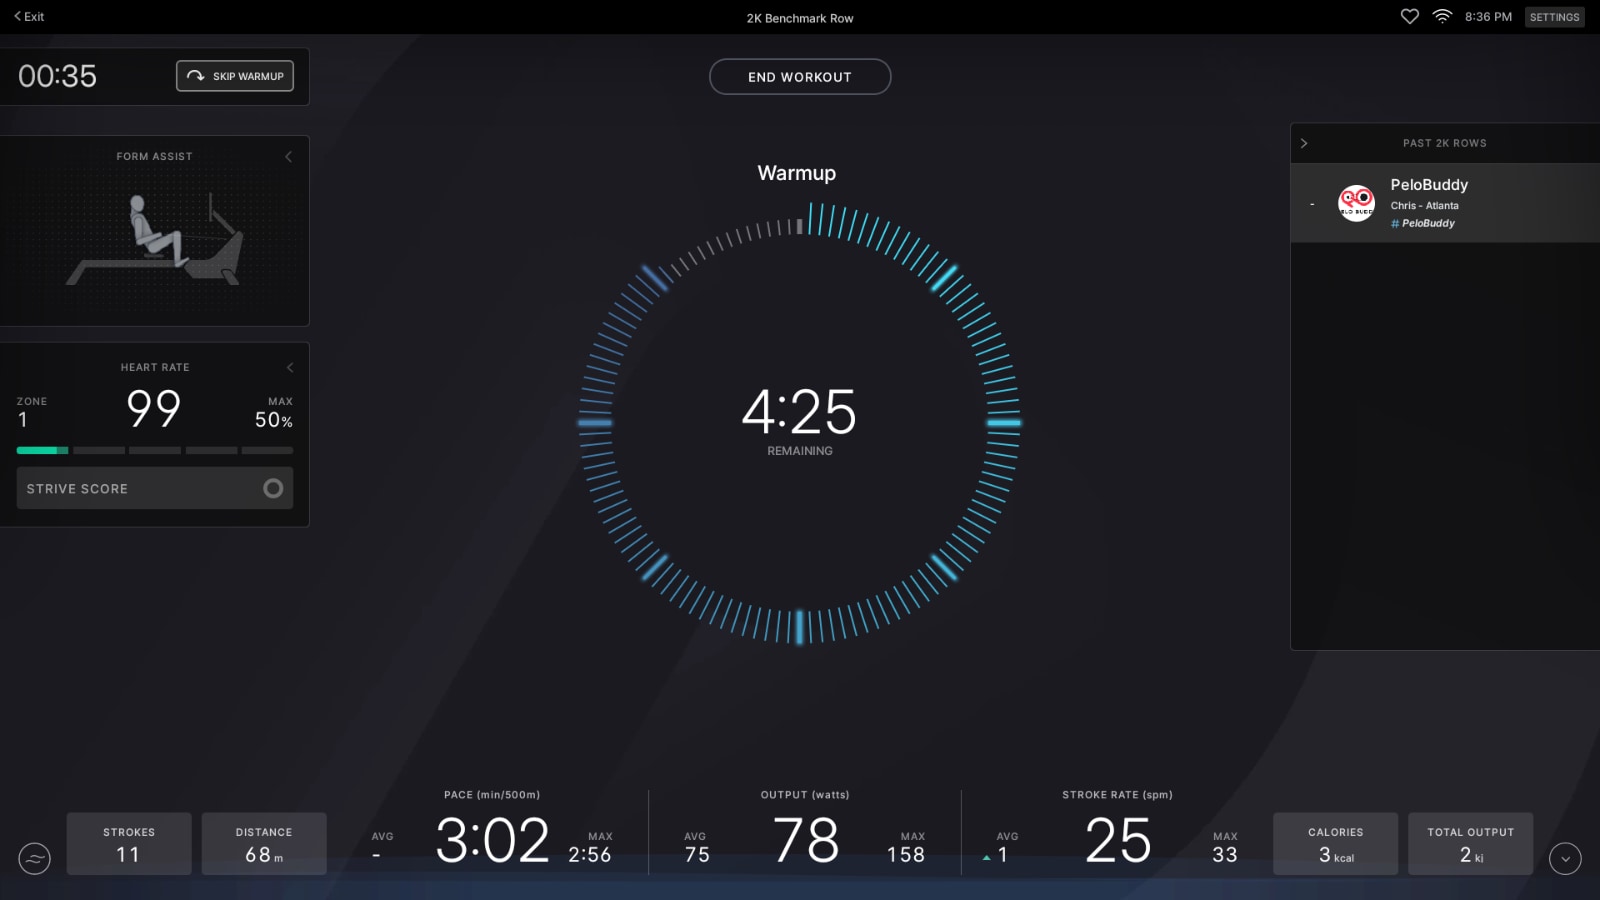
You may choose to skip the warmup at any point. There is a “Skip Warmup” button at the top left of the screen. This will cause the timer to jump to 10 seconds left in the warmup. If you don’t use the skip button, you’ll continue your warmup for 5 minutes. Then, with 10 seconds left, there will start to be a beep every second until the timer hits 0, notifying you the test is beginning. If you used the Skip Warmup button, you’ll only get a single beep when the timer hits 0.
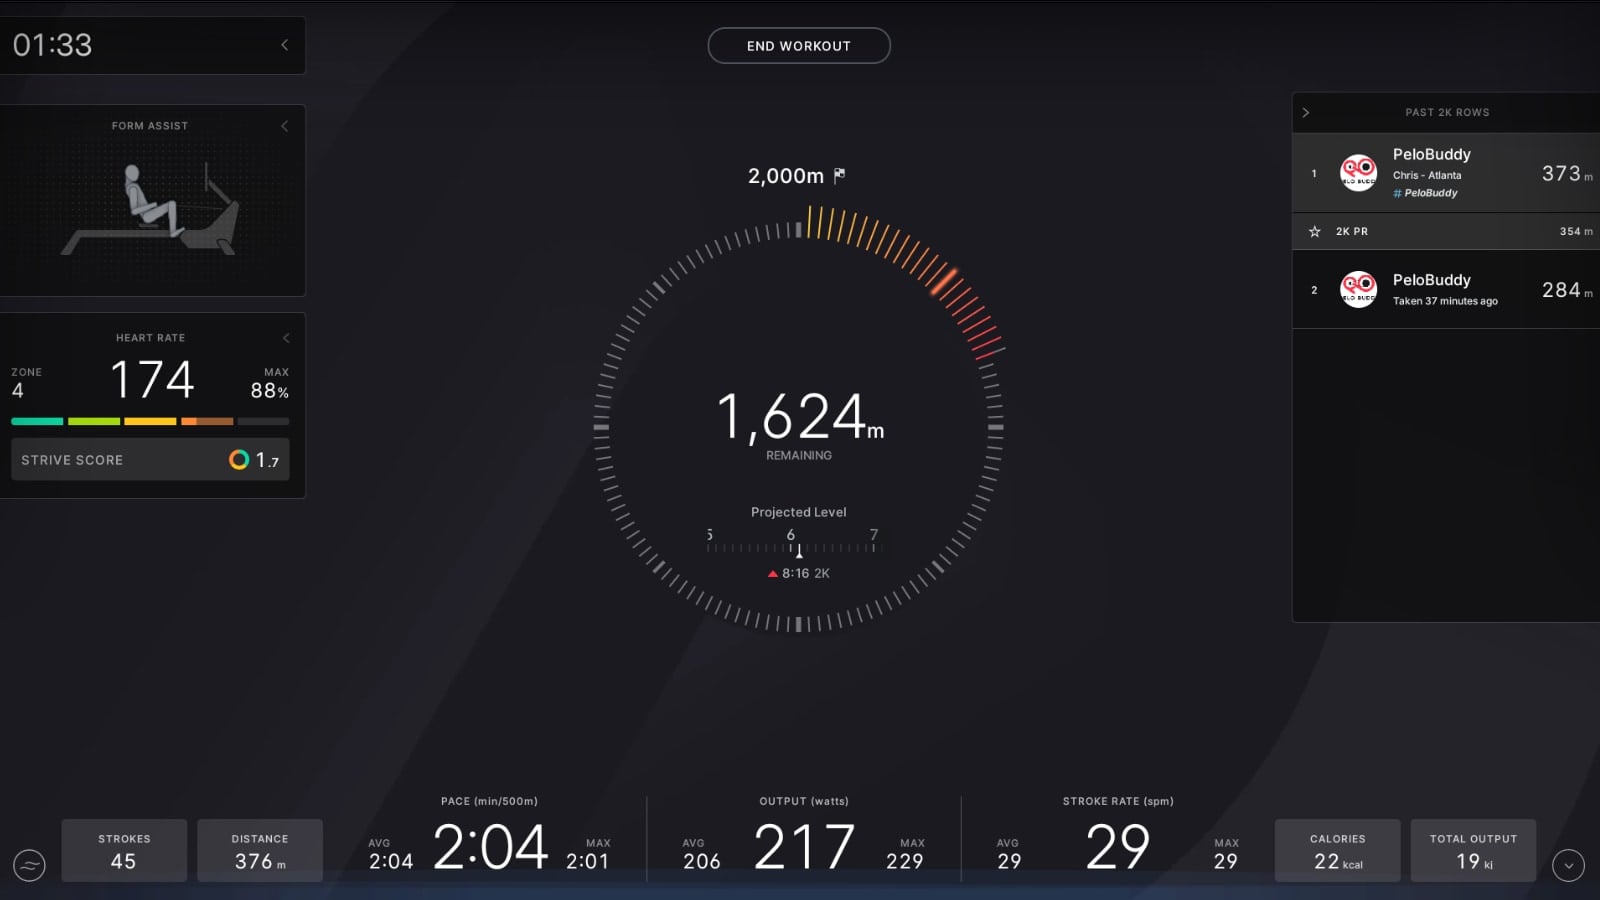
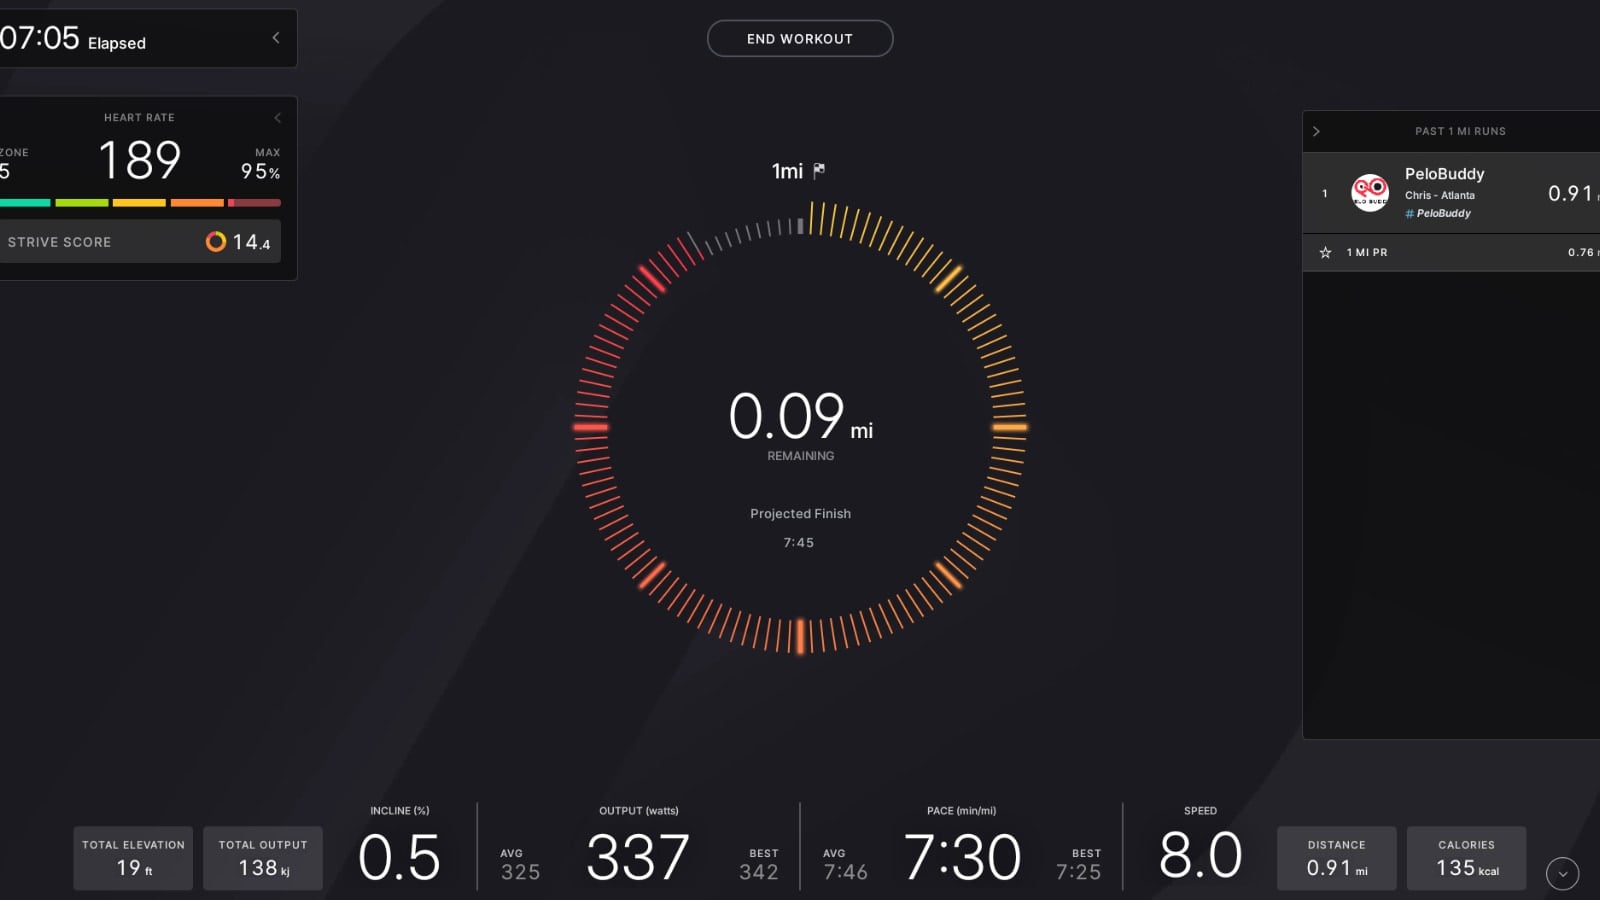
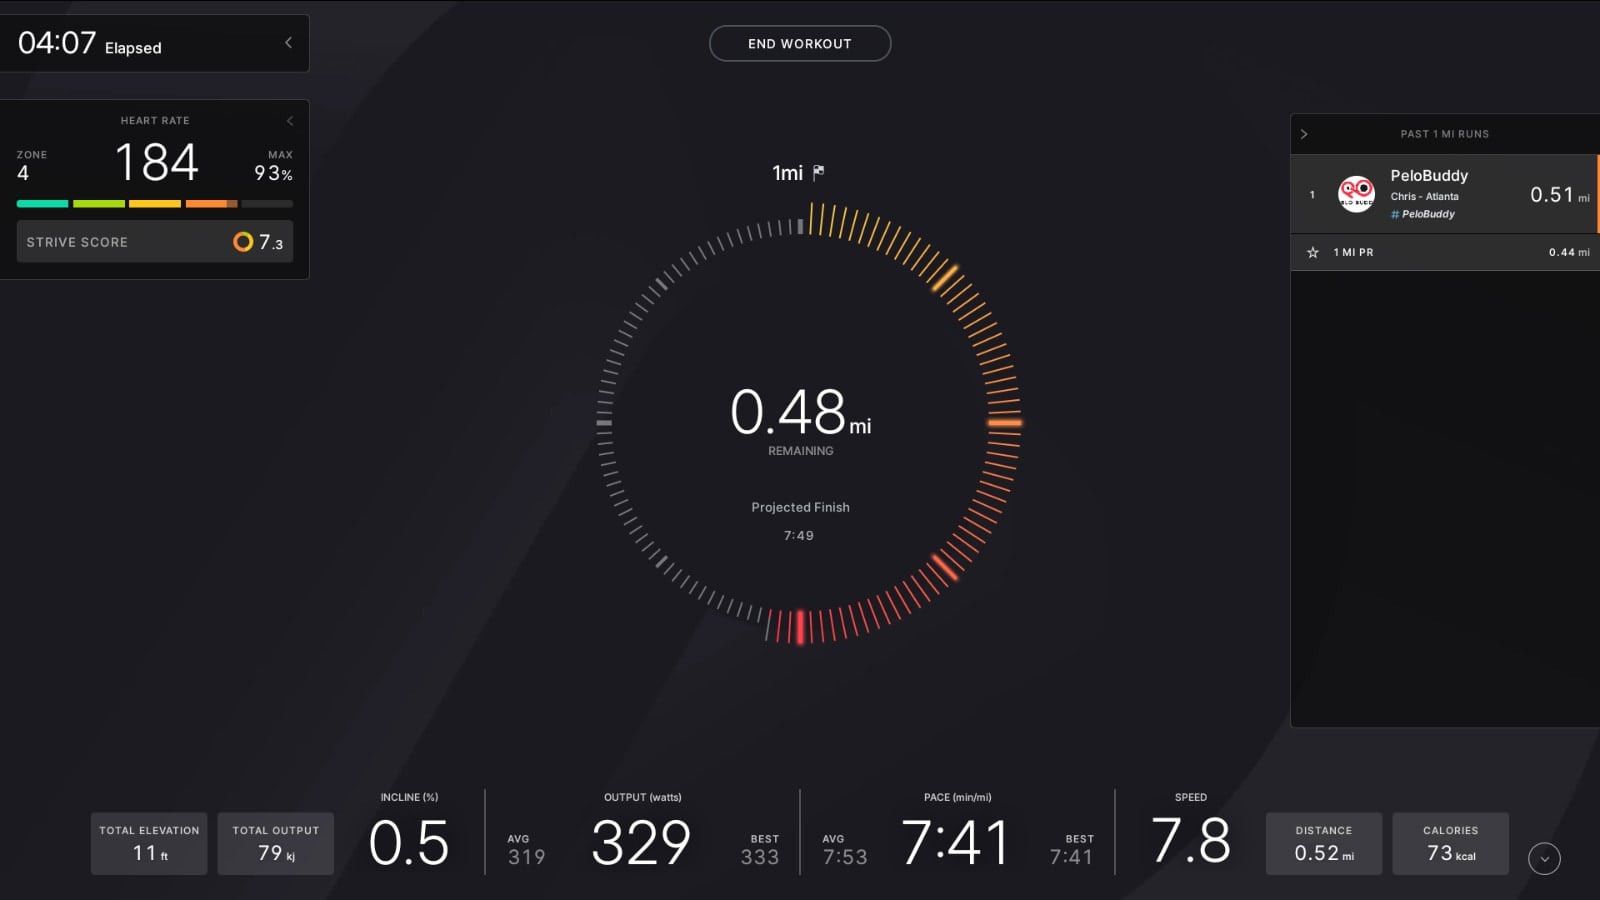
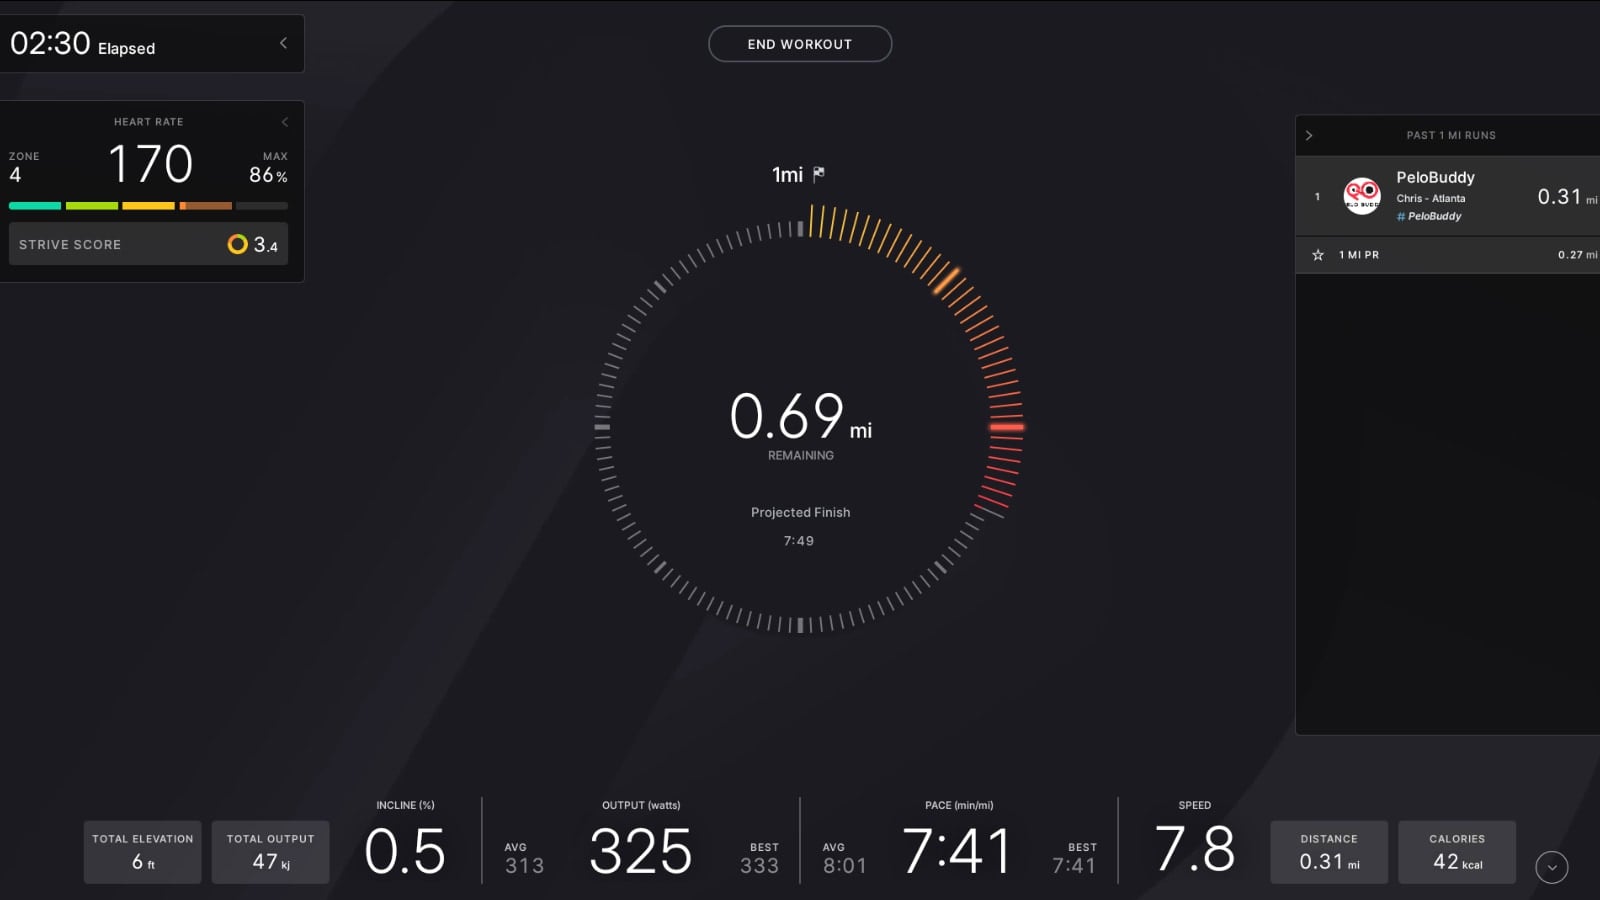
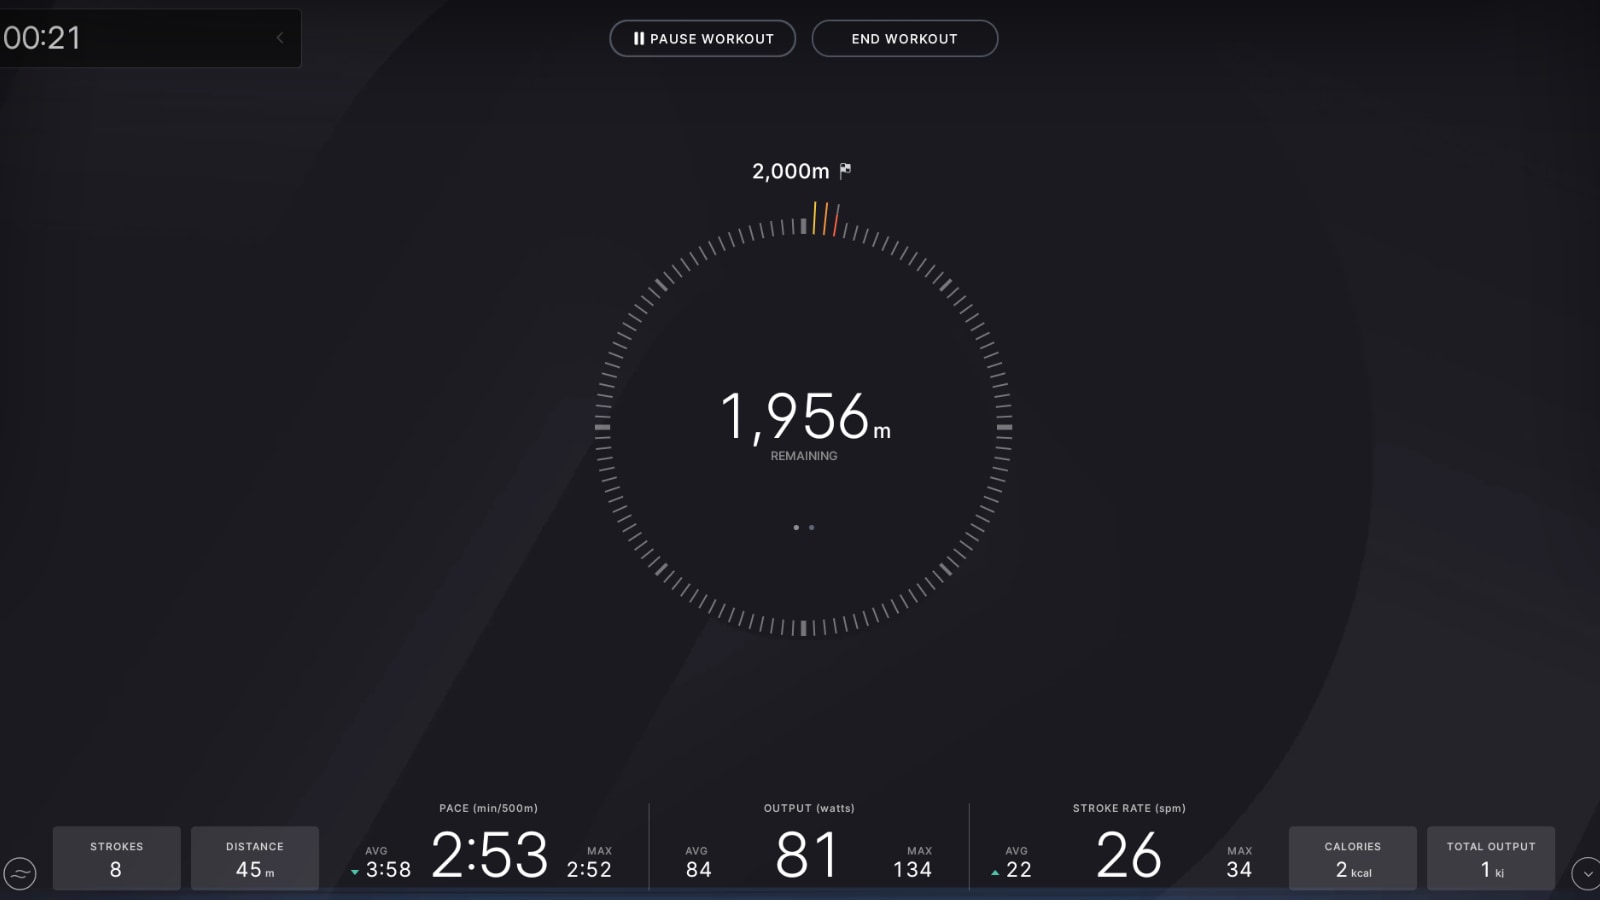
At that point, the test has begun. There is no big change to the UI, or no big animation. The screen simply changes from being a timer countdown to instead counting down how many meters or miles you have left in the test – and the time starts counting up, showing you how long you’ve taken so far.
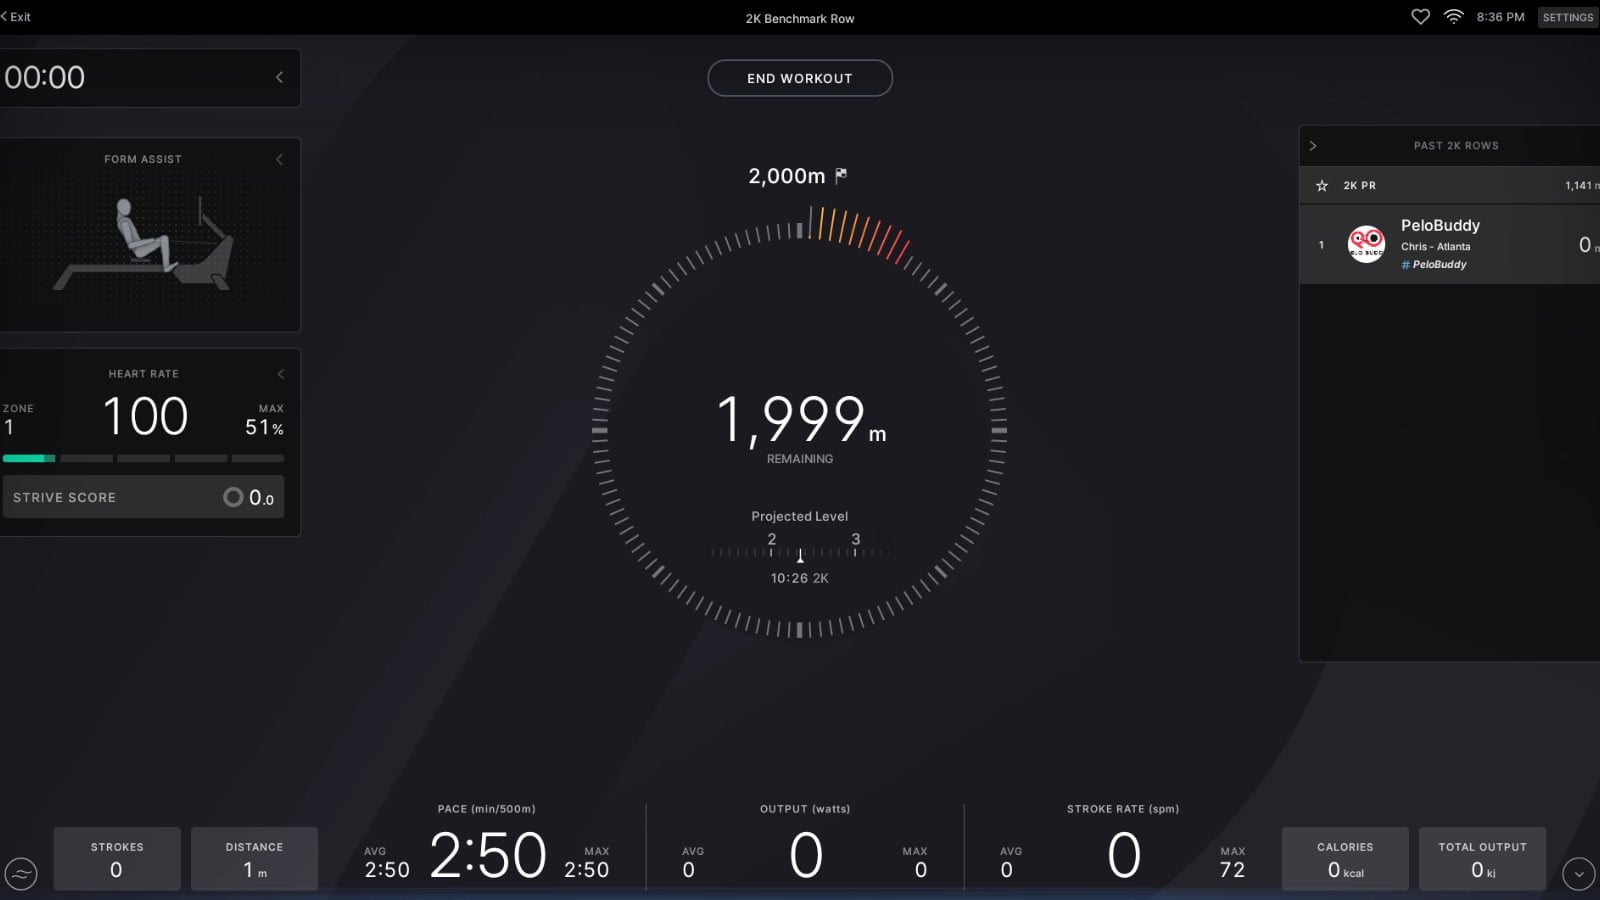
The screen will show you how far you have left in two different ways on the screen. One is with a numerical countdown in the middle of the screen, showing the exact distance left. The other is by a large circle / ring that is drawn around the number. This ring is animated and filled as you progress. Once the ring is filled, your test is complete (it will also say you have 0 miles, or 0 meters, left at this point as well).
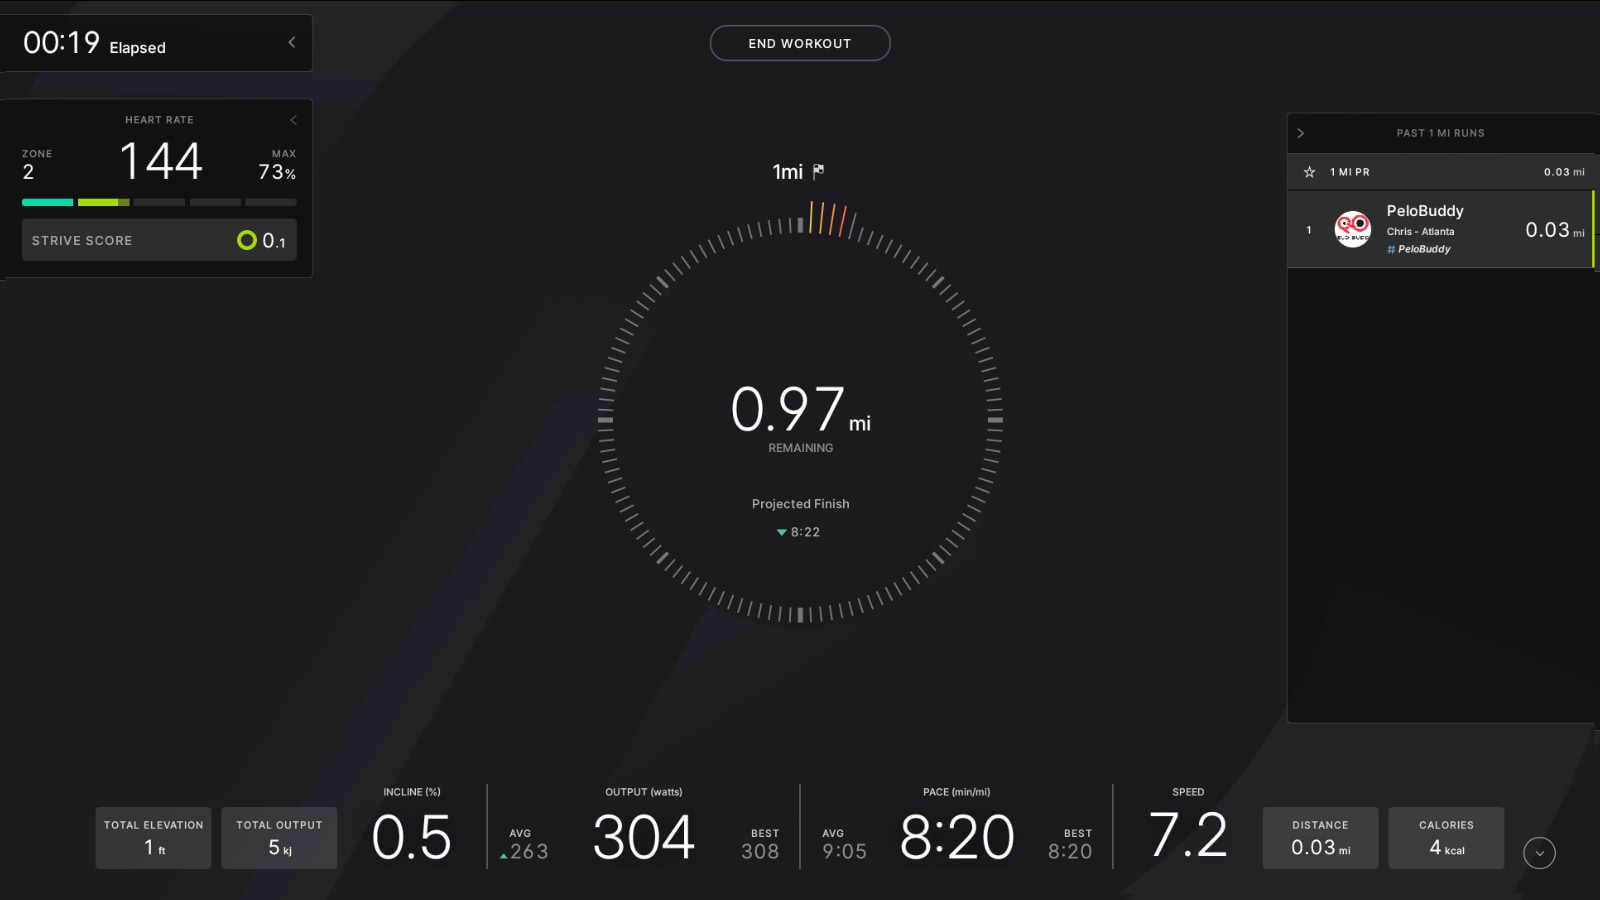
Underneath the large number showing you the distance left, you’ll find a smaller number titled “Projected Finish”. This is the projected time for your benchmark test, based on your current pace and the distance you’ve covered so far.
In addition, on the row, it will also show you a projected pace target level. That is the suggested pace target level it thinks you should be in, if you finish the test at your current pace. At this time, the Tread does not have this projected pace target level animation in real time. On the row, your “projected finish” time is shown just underneath the projected pace target level animation.
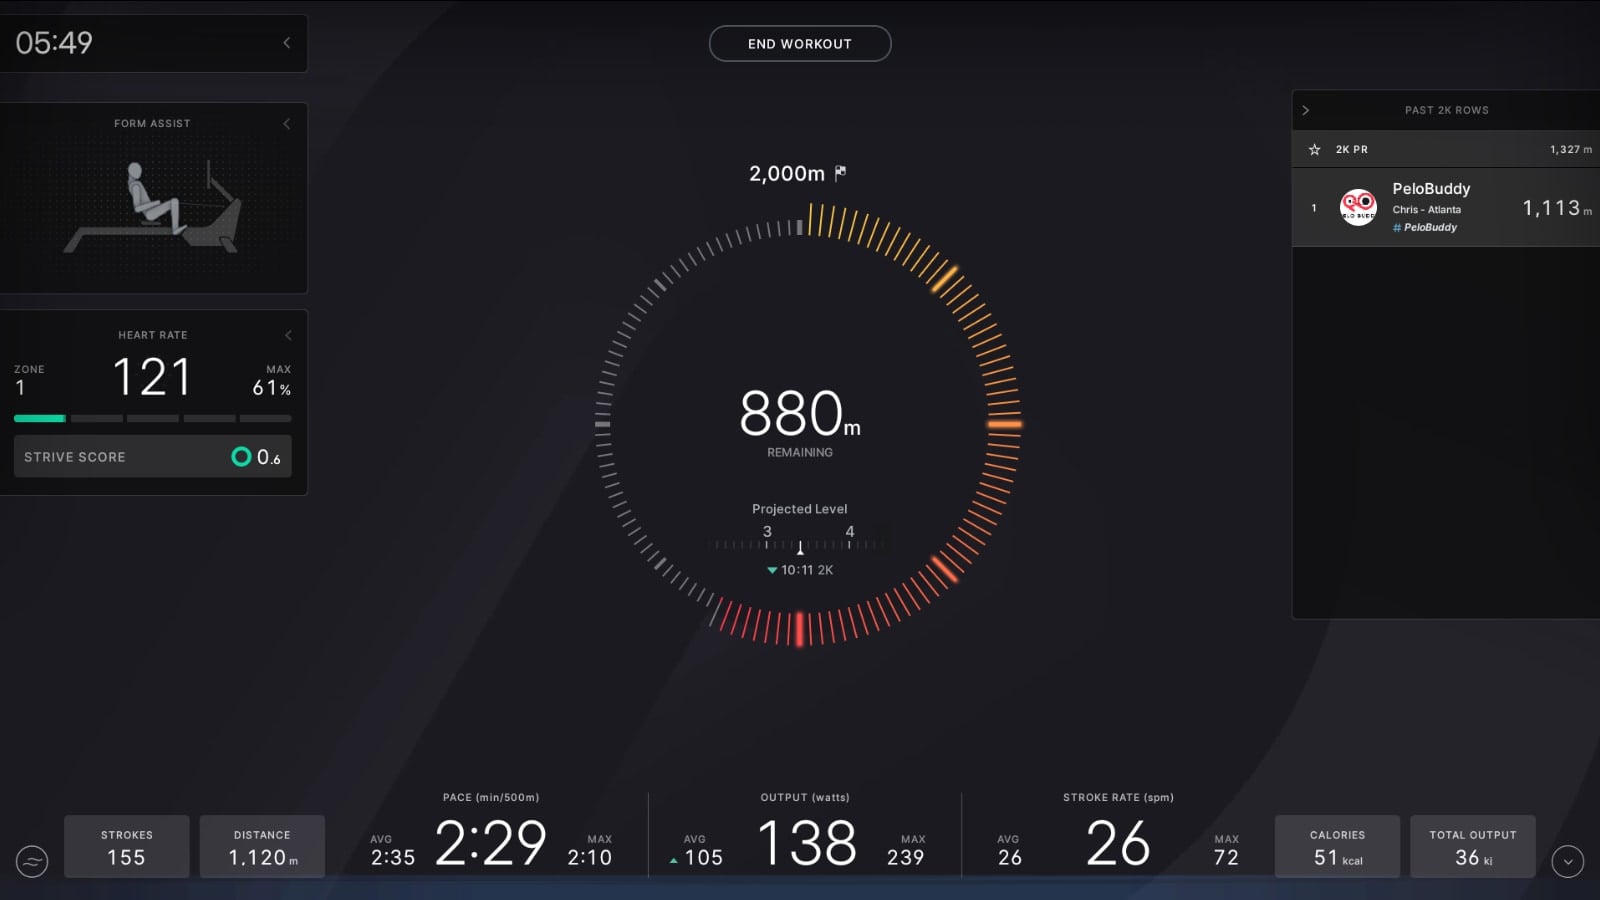
All of your usual metrics are tracked – heart rate, pace, distance, speed, stroke rate, and output. There is also a leaderboard, allowing you to compare your performance against either your history, or your PR. Even if you have never taken a benchmark test before, assuming you’ve done a run of over 1 mile, or a row over more than 2km, it will use whatever your PR was for that distance to give you a number to race against.
Then, once you’ve taken a benchmark test, and come back to re-test, you’ll see your previous benchmark test performance shown on the leaderboard as well. The leaderboard will only ever show your personal data & efforts – not any of the people you follow.
Once you have completed the test, you’ll get a screen telling you your test was completed.
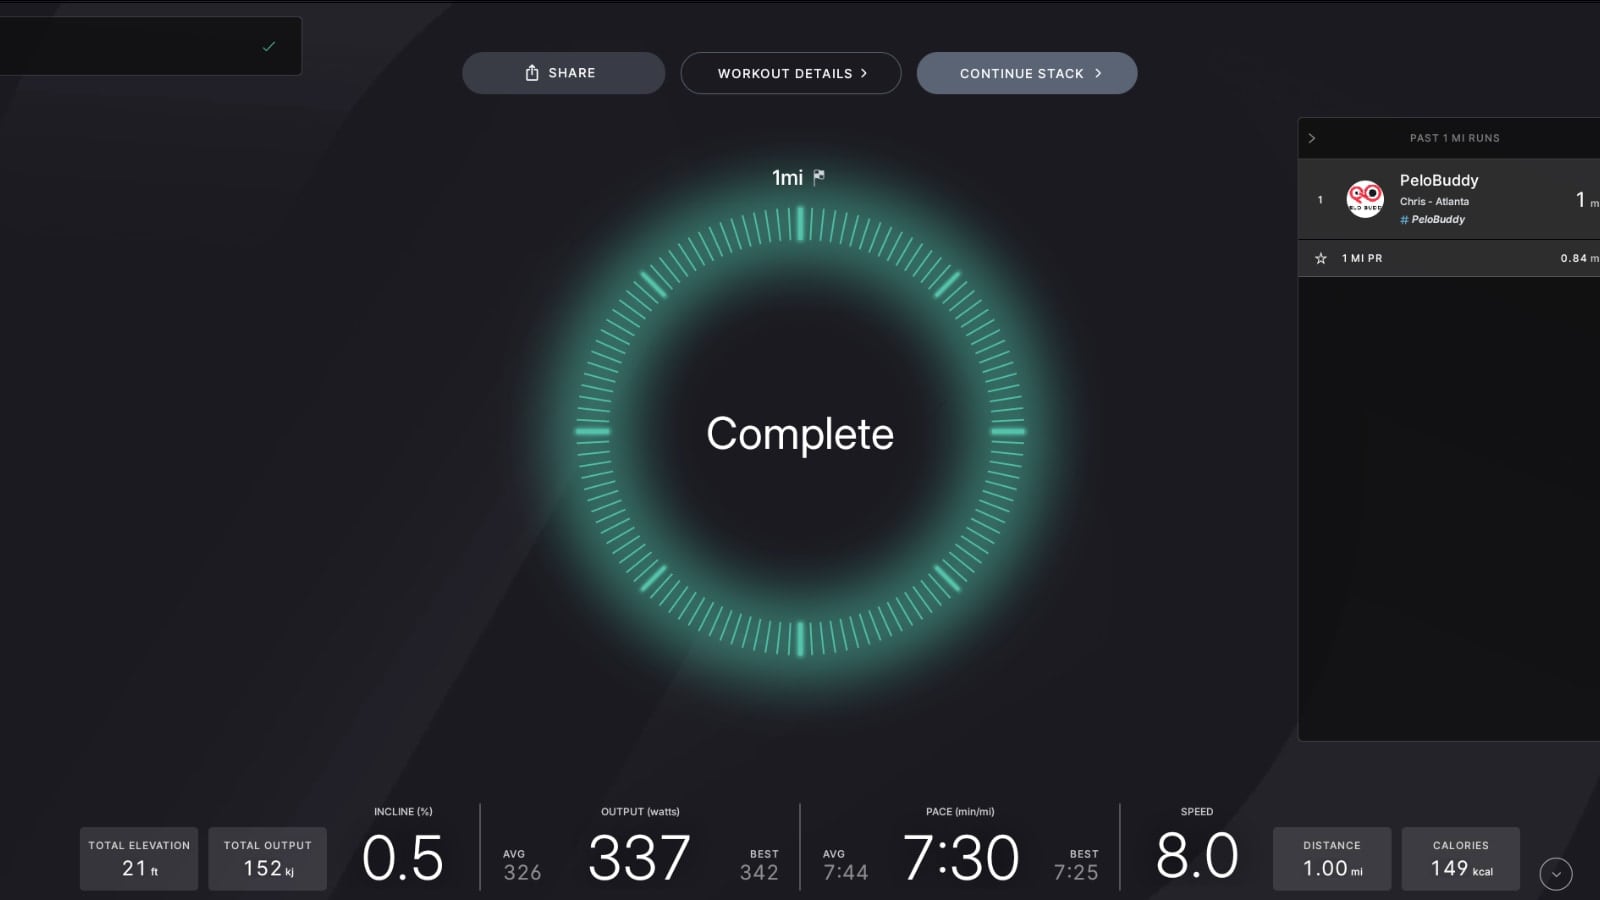
That screen will go away, and you’ll then have your result highlighted for you.
Then you’ll get a new screen showing your performance. The first time you take the test, it will be a placeholder screen – showing you the stats for that test, and with a note that there will be more data next time. On the Tread, it will show you your total time, and average speed (in mph)
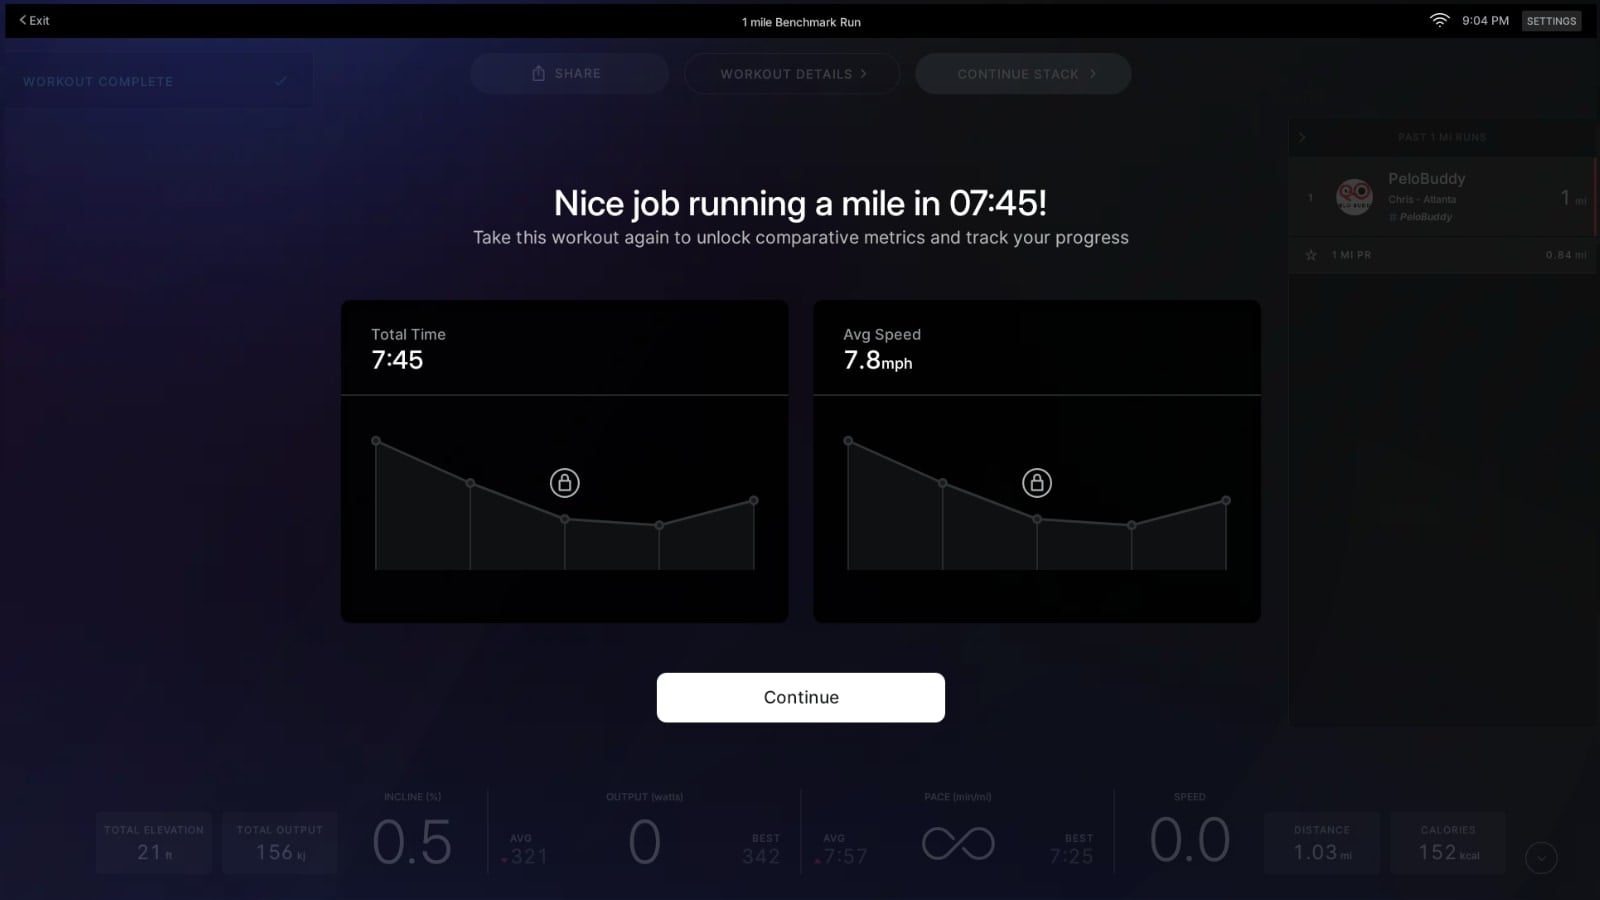
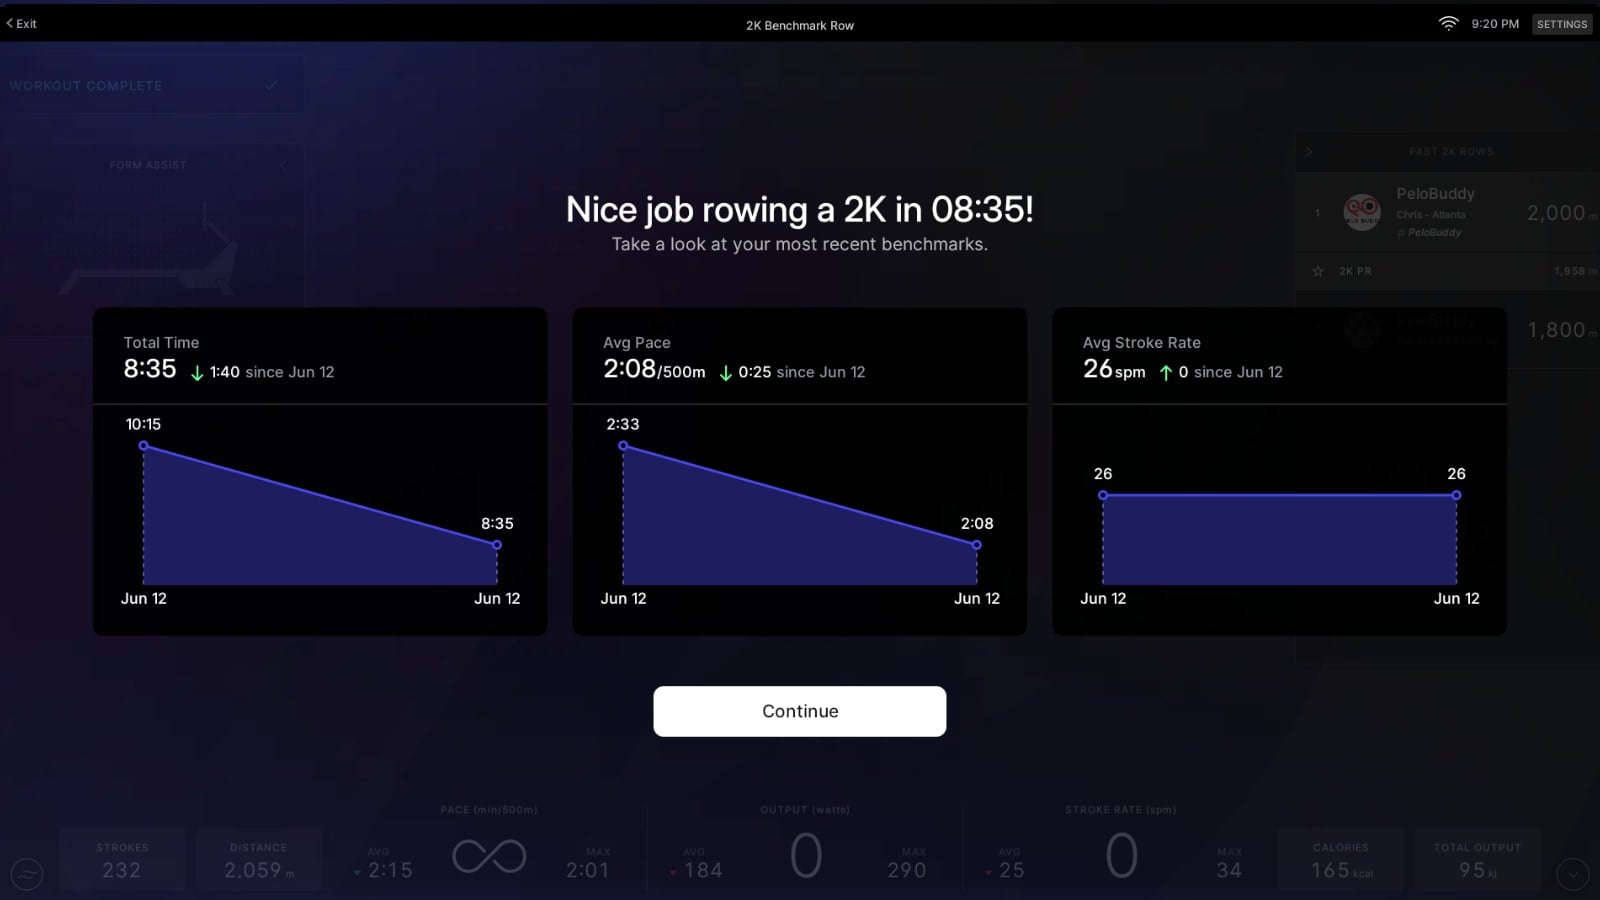
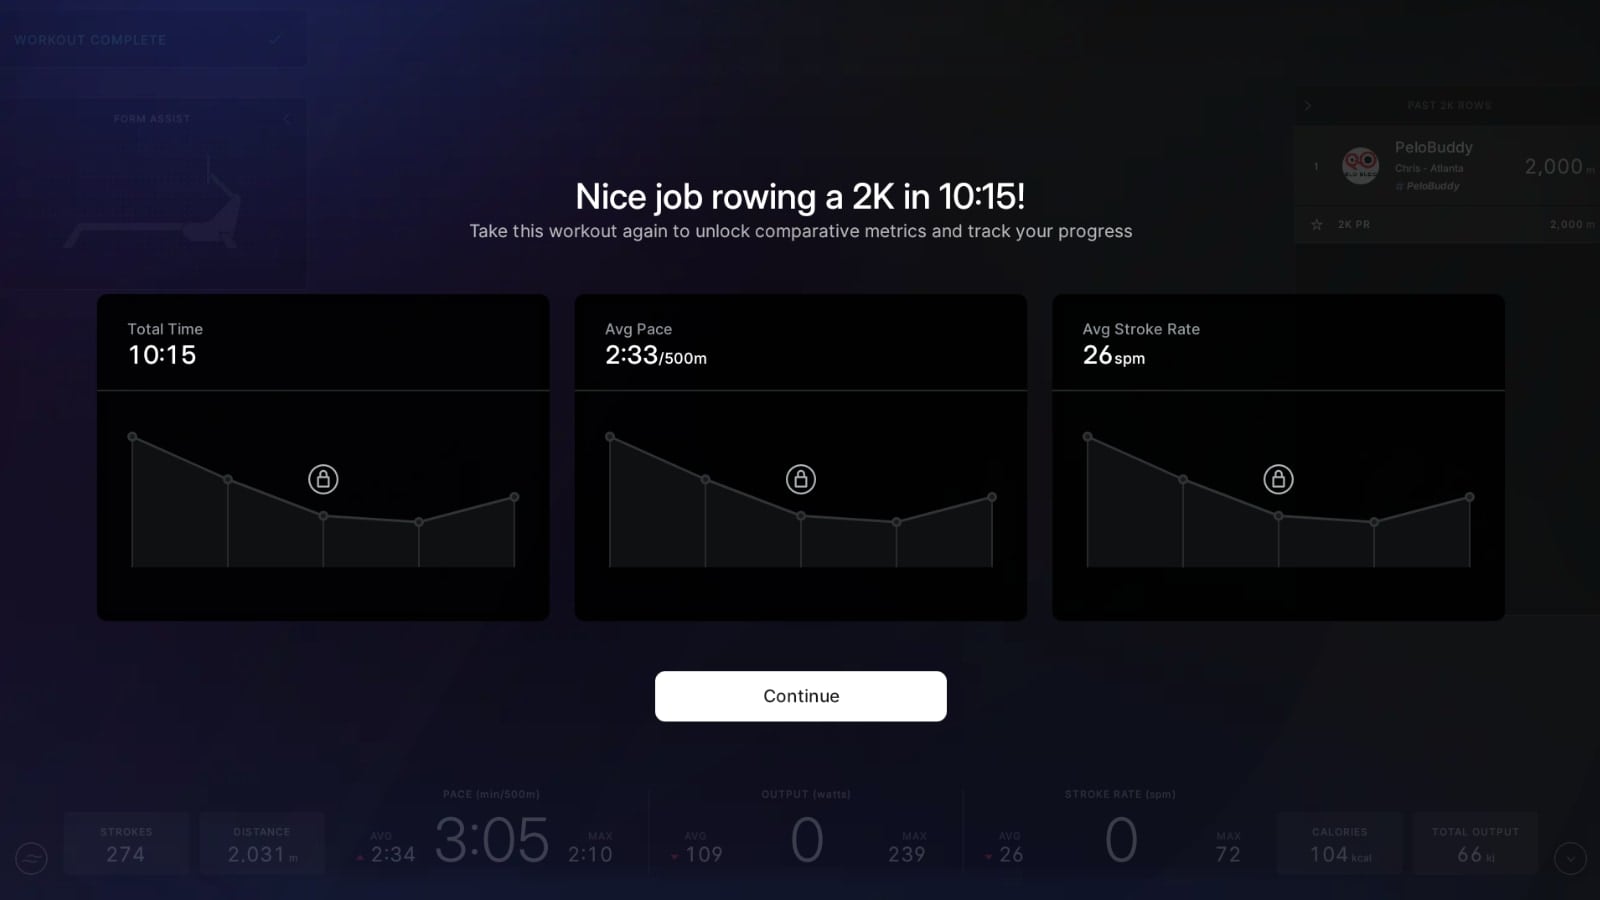
On the Row, you’ll see your total time, average pace, and average stroke rate.
Then, when you take a performance test for a second (or more) time, that screen has graphs showing how this test compared to your previous efforts.
At this time, the graphs will show your five most recent performance tests. If you have a performance test that wasn’t your best effort, you can always delete it from your workout history to free up space for another performance test.
However, you shouldn’t delete a test just because you didn’t do better than your previous tests. People’s fitness goes through peaks and valleys – performance is not a forever-increasing line.
Once you are done viewing the comparison graph, and hit “Continue”, the screen returns to the normal post-workout screen.
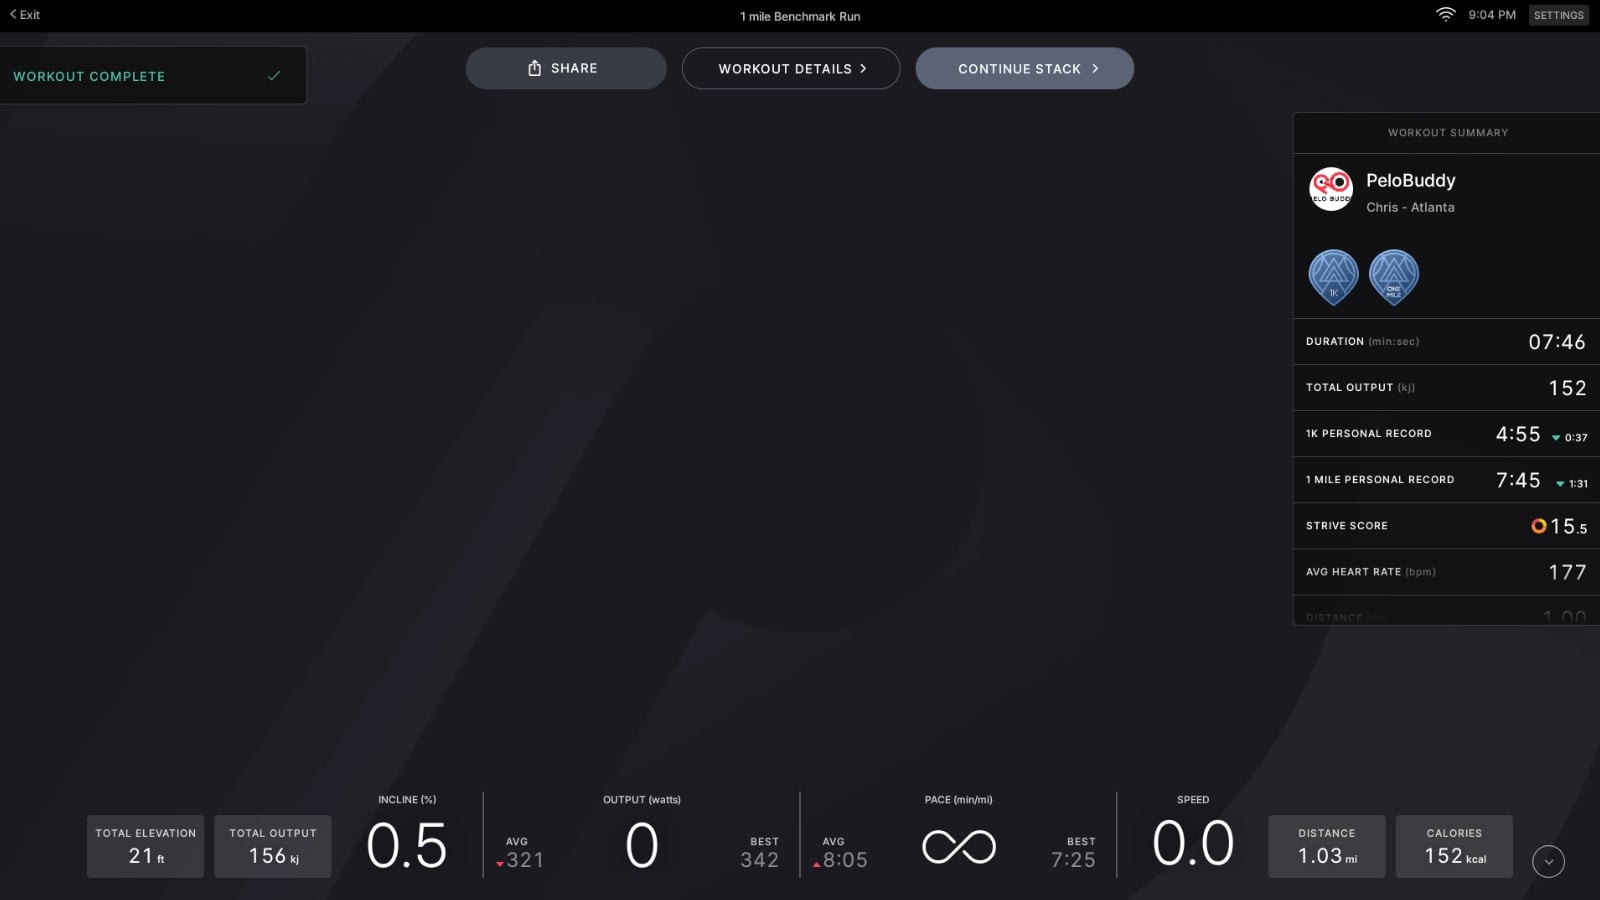
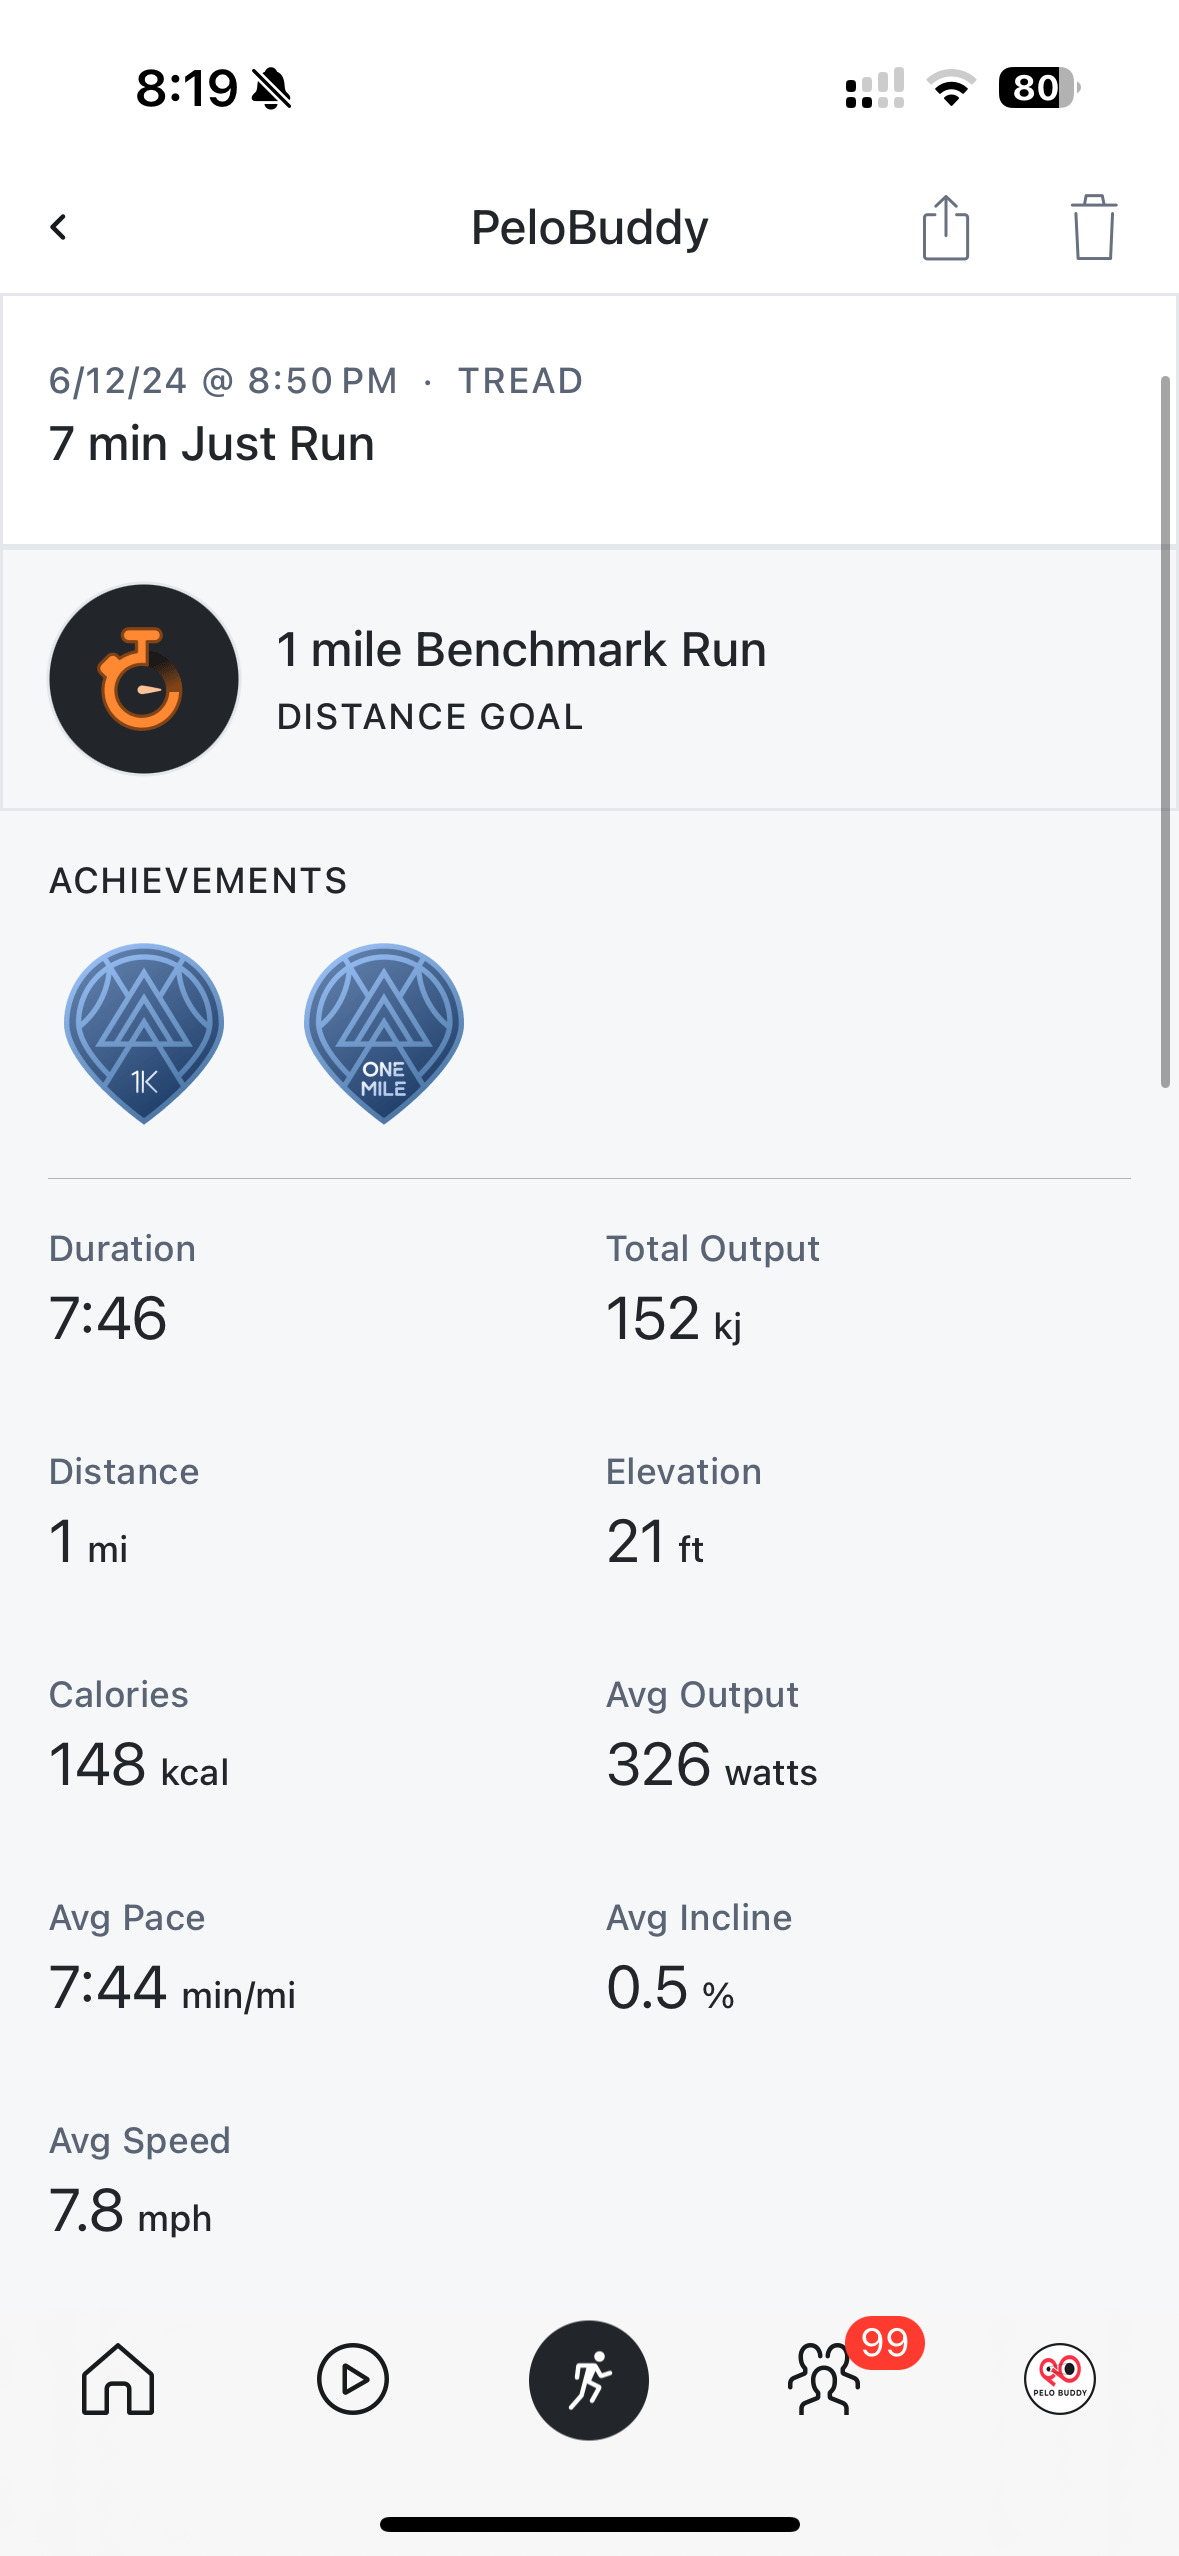
From there, you can either move on to your next workout, or go to “Workout Details” to view the data in your profile on the device. The data shown here looks just like any other “Just Workout” class. As mentioned above, at this time, there unfortunately isn’t a way from here to pull back up the comparison graph to other Benchmark tests – we hope that will be added soon.
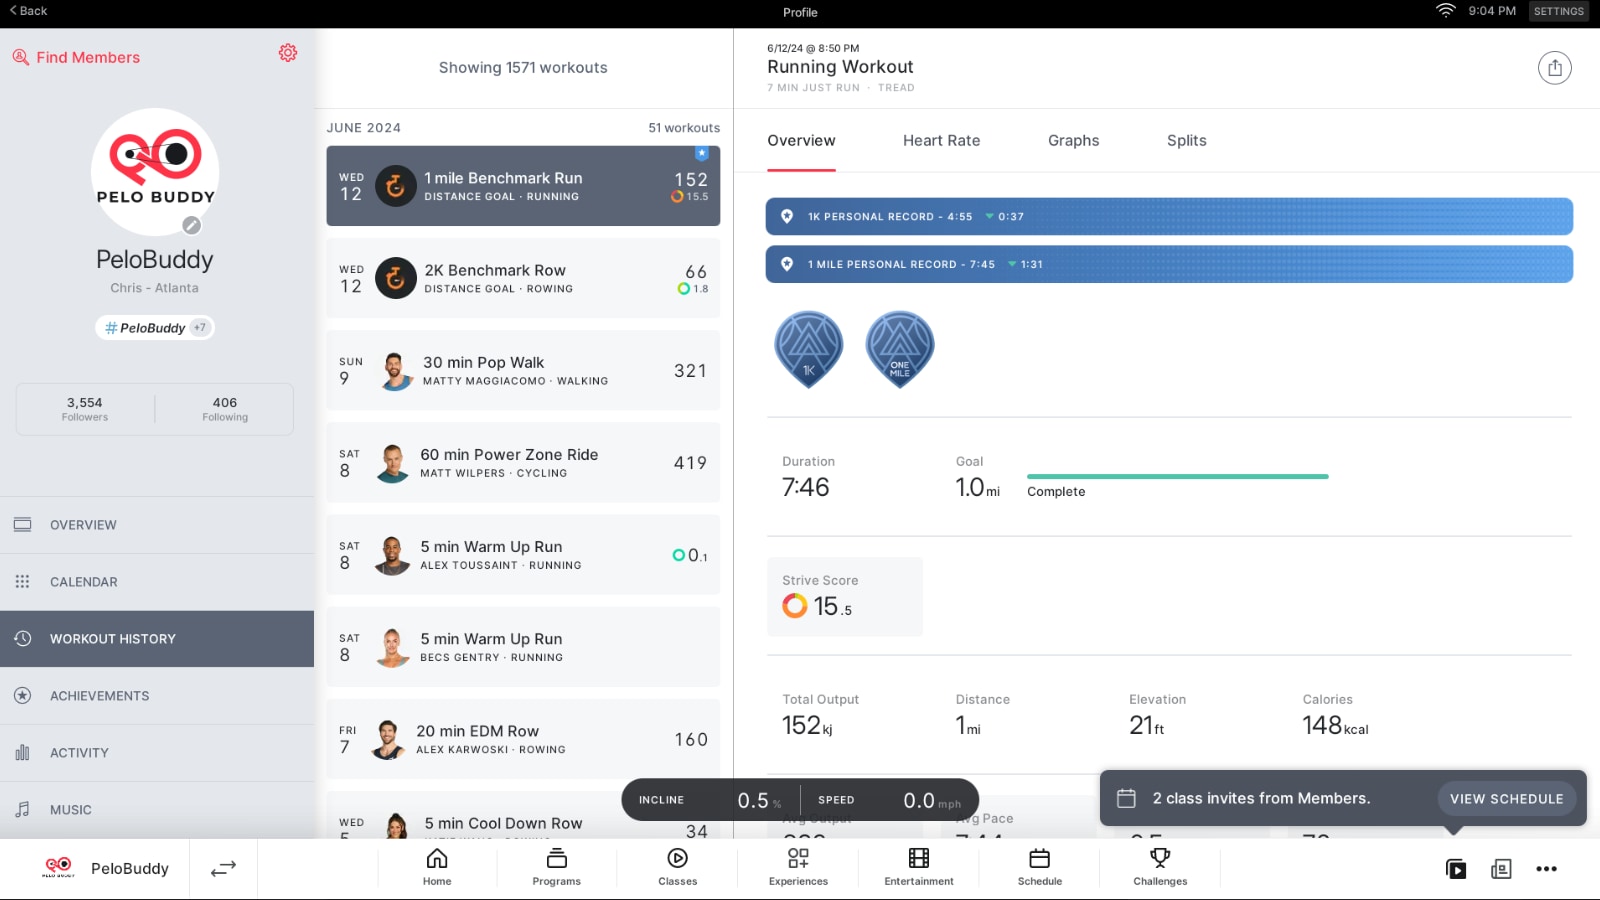
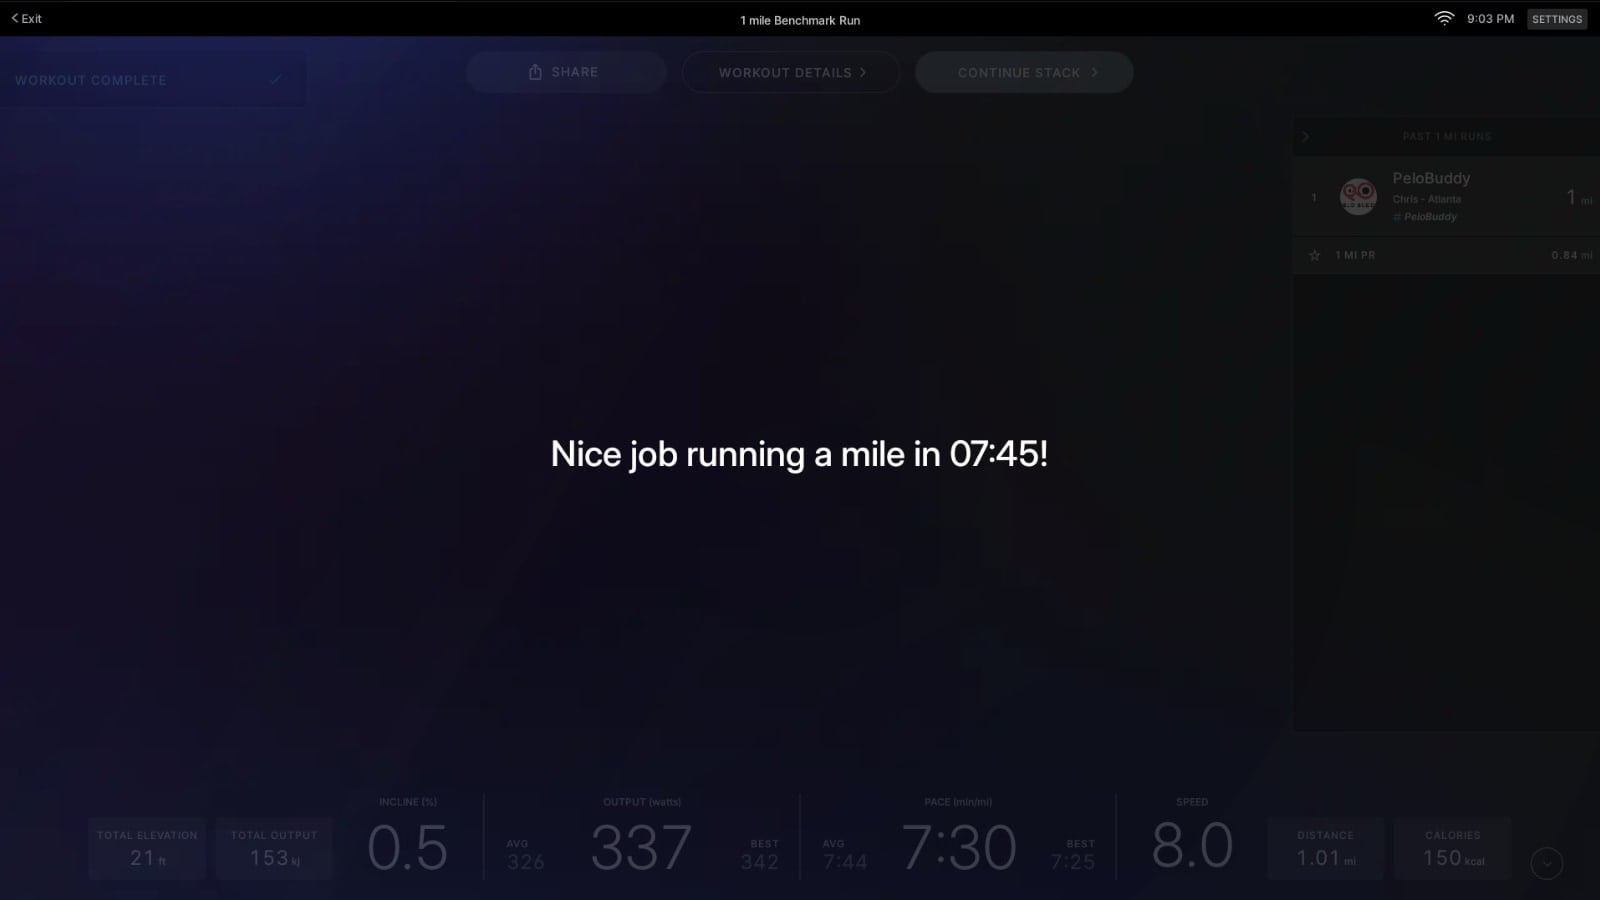
You are also able to view these benchmark tests in the Peloton app or website, just as you would any other class. They are labeled “2k Benchmark Row” or “1 mile Benchmark Run” in your workout history page.
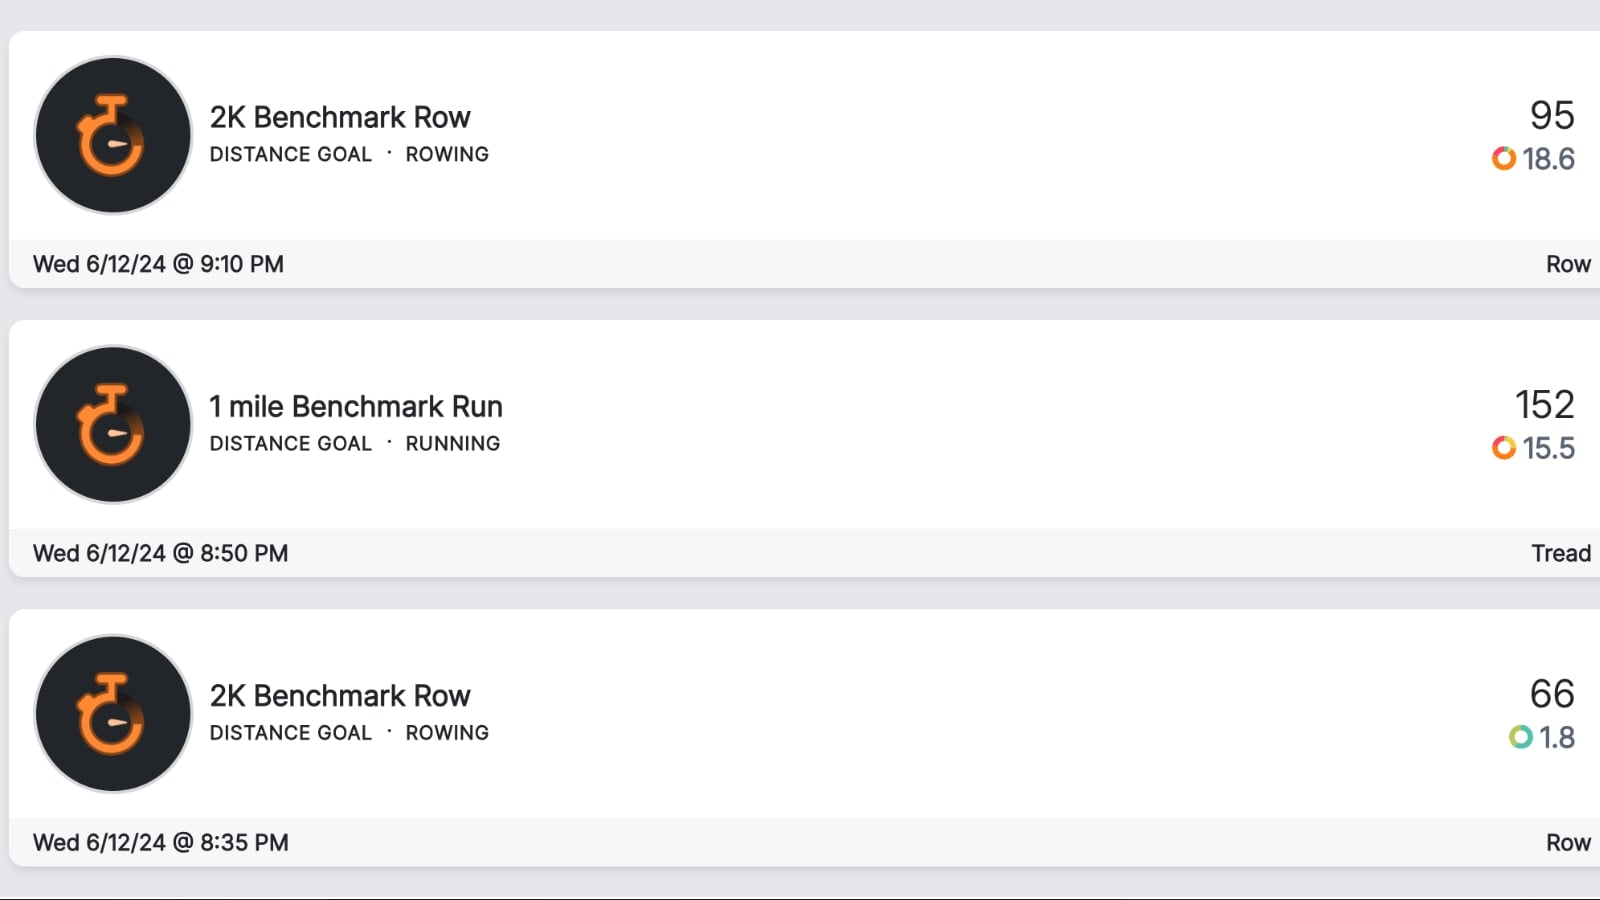
Similar to when viewing the data on the device, the data shown on the app looks like any other Just Workout class – except it also has a line noting it was a Benchmark test.
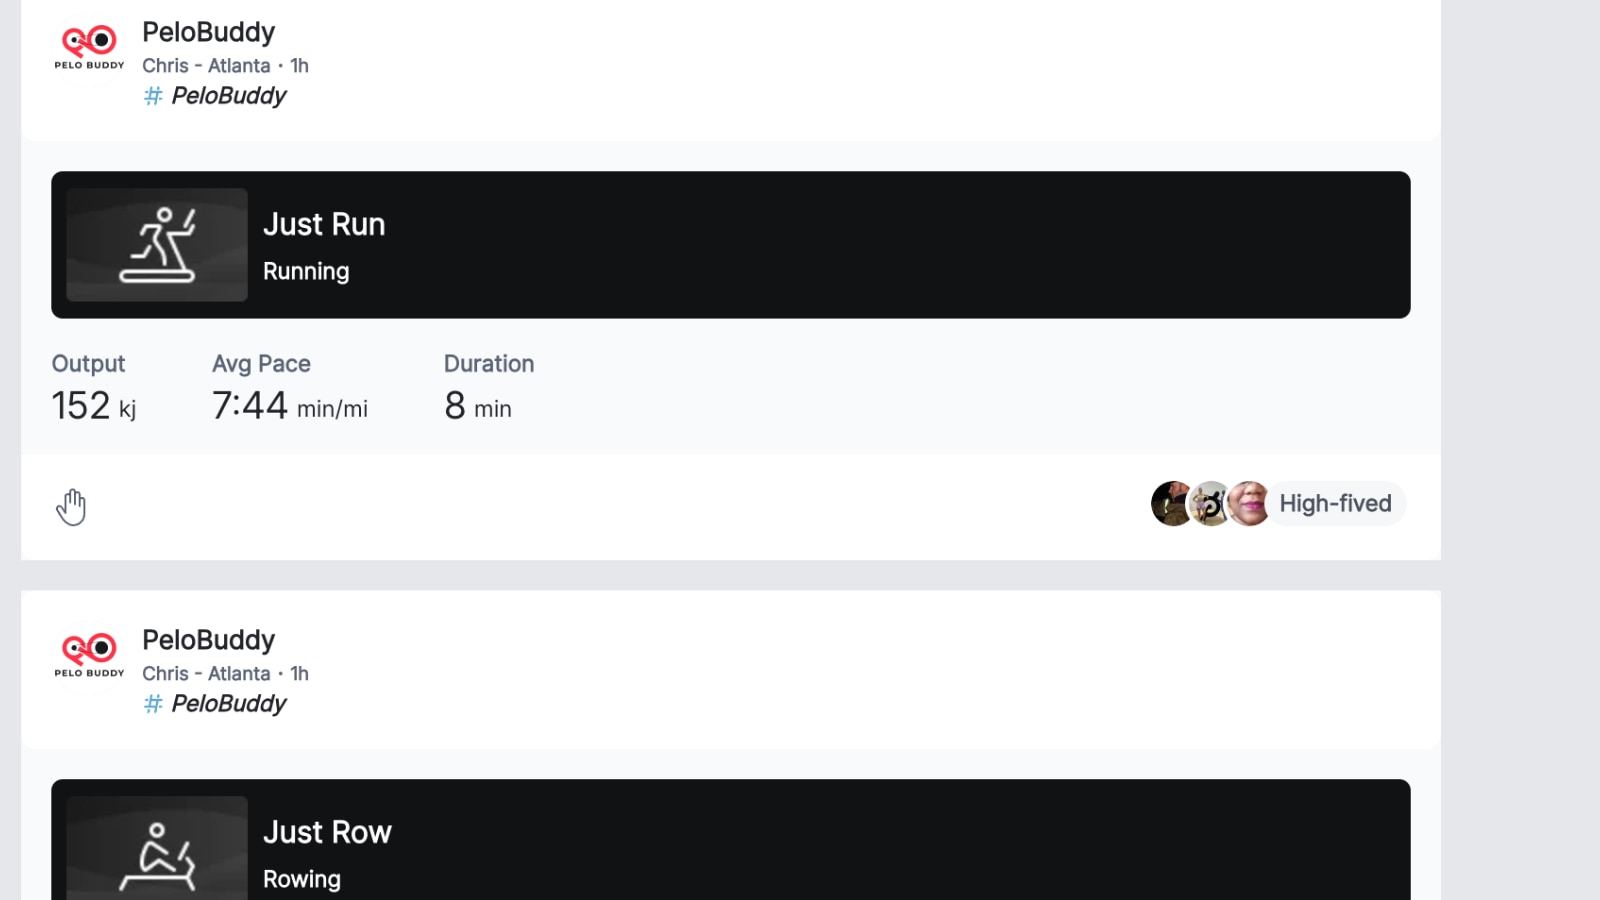
The benchmark tests will also show up in the Peloton Feed – where you see both your and your friends’ workouts. Currently, they show up in the feed as a “Just Row” or 2,000m or “Just Run” of 1 mile. Then, when clicking into it, you see that it was a benchmark test.
There are two primary things people will likely do with the data from their benchmark tests. First – is simply use it as a benchmark to track their performance over time – using the graphs and popups to easily see their progress over time.
However, these benchmark tests will also end up being used to help people pick their difficulty level for the pace target classes on both the Row & Tread.
At this time, Peloton does not appear to be auto-prompting you with a popup to adjust your pace target level if you set a new PR. However, they are using the data to suggest a new level if you go into the settings page when starting a new workout.
For example, in our test scenario, we set a new PR of 7:45 for our mile benchmark test.
Now, before our next pace target class, we used the pre-class popup screen to go back into the Pace Target settings. You do this by clicking the “Pace Target” section of the screen just before hitting start.
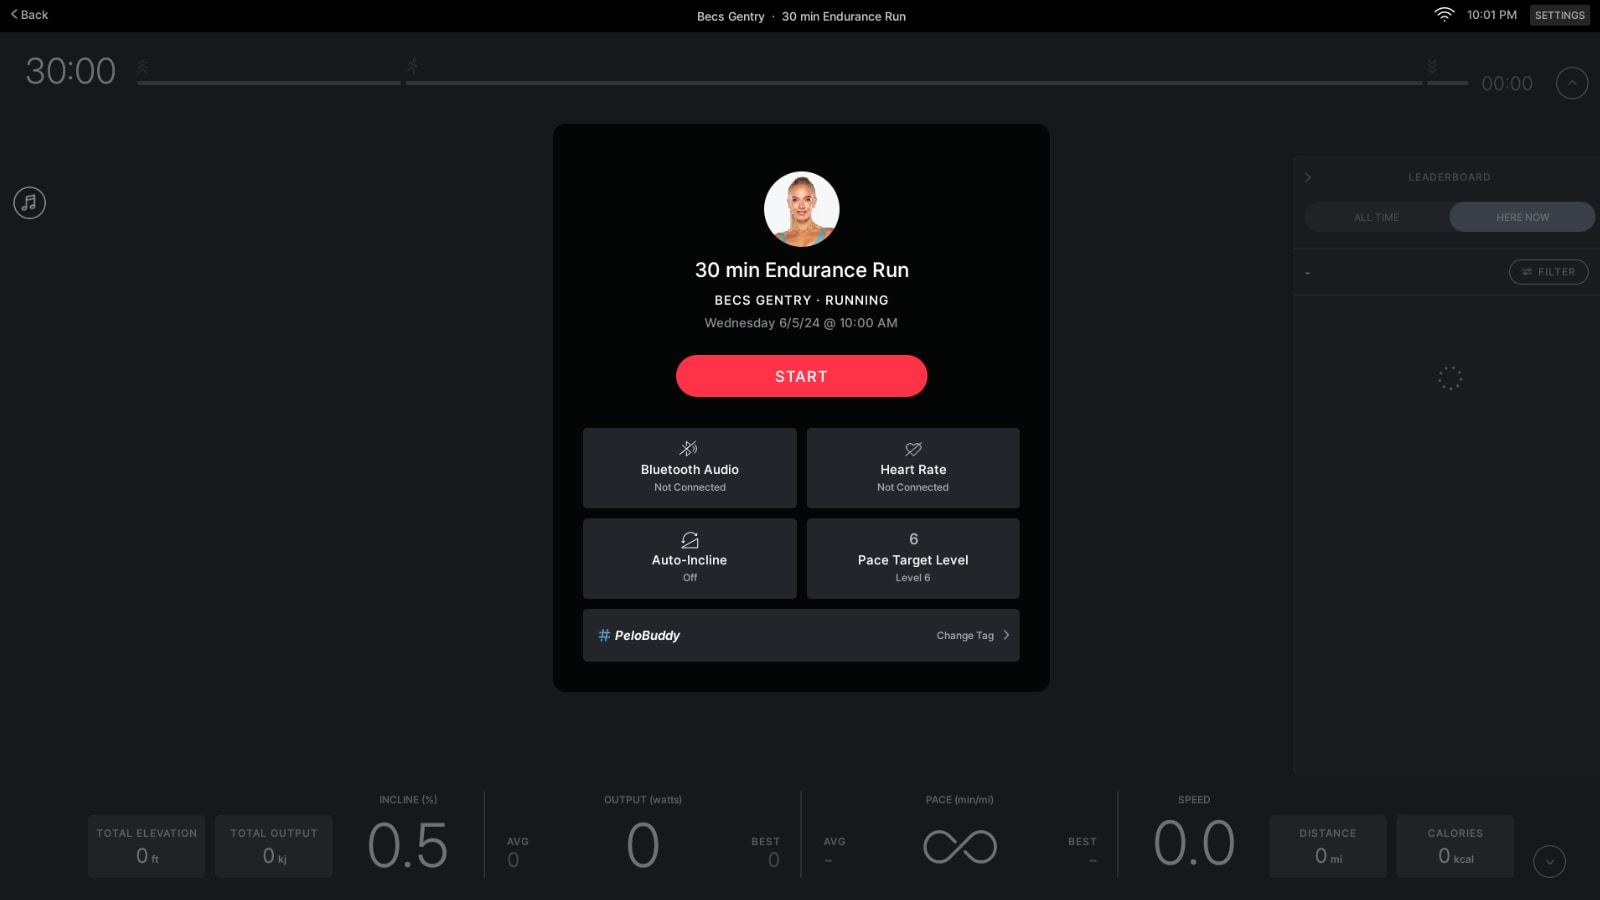
Previously, our PR for the run had been at a slower pace – and after taking the Intro to Pace Targets class we had set our Pace Target Level at 6.
Now the Peloton Tread is using our brand new PR, and is factoring that into the Pace Target selection screen. When the pace target screen opens, level 6 is still selected – but there’s now a text box just over the level that says “Below Suggested”. This is “based on your best mile of 7:45”. This means that Peloton is suggesting we go up one or more level.
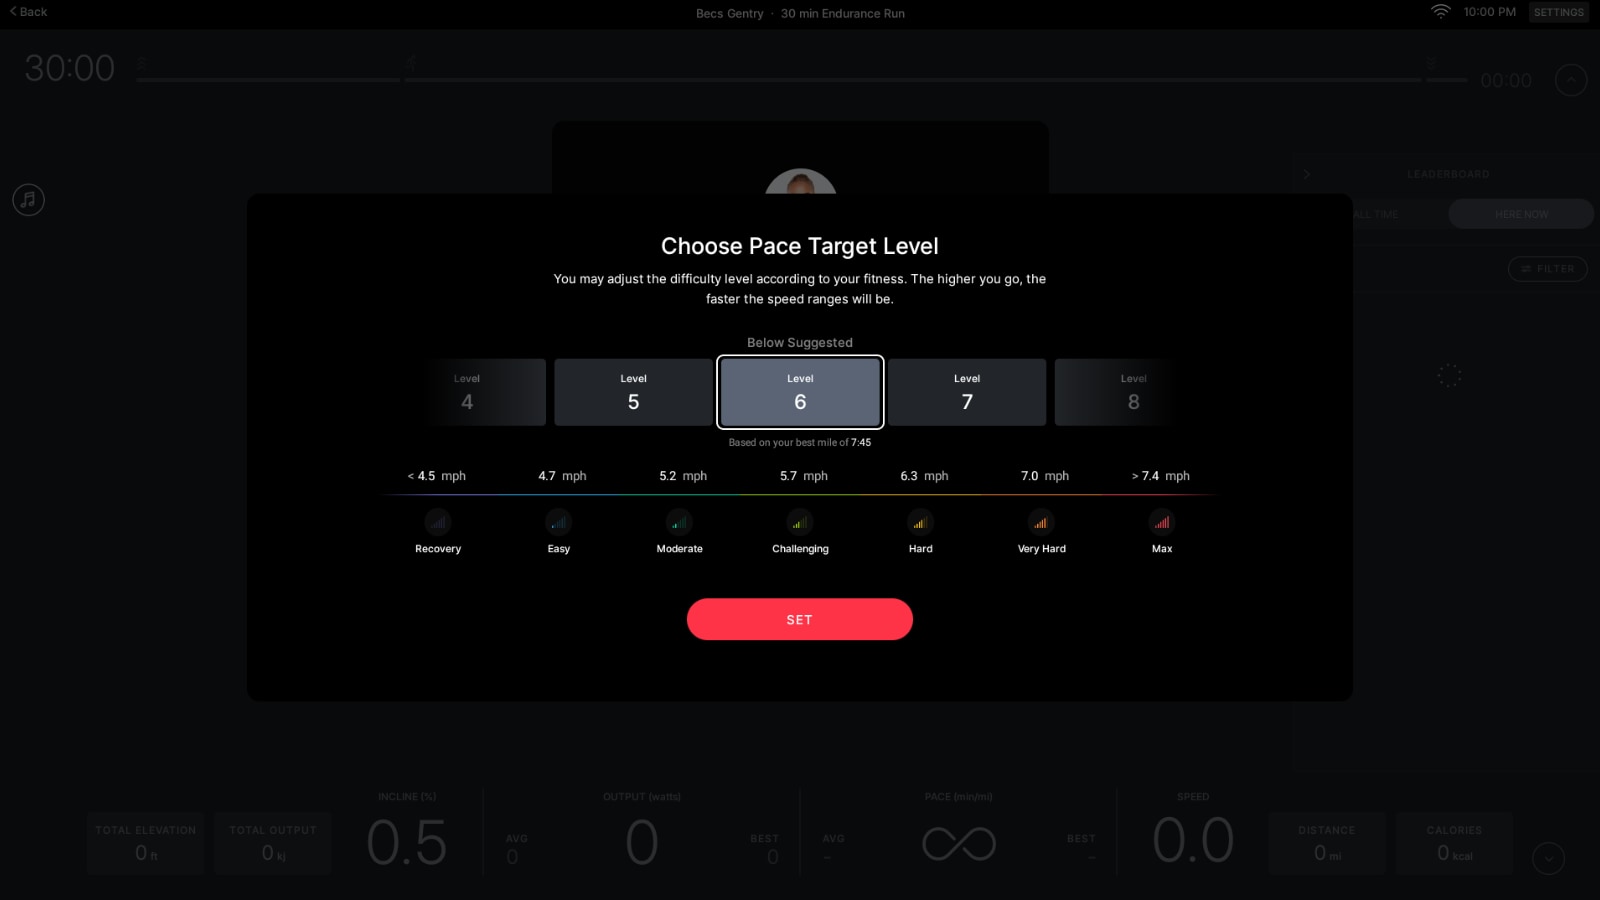
On that screen, you can swipe the Difficulty levels to bump up to the next level. After adjusting our Level to 7, that message now changed to “Suggested” – meaning that based on our benchmark test we just completed, Peloton would expect most people to be at a Level 7.

At this time, those steps are manual. You have to choose to click into the pace target screen before class, see that it says “Below Suggested”, and adjust it. This is a one time thing you have to do – and after we start this class at Level 7, it will stay at Level 7 until we change it again.
However, down the road, we can see Peloton making some small updates here. Namely – after taking a benchmark test, if it detects your Pace Target Difficultly level is not what it would “suggest”, it could immediately pop up this dialog at the end of the test, and guide you to immediately change the level.
This is how FTP tests work on the bike. After you finish the test, you are asked if you want to use your new FTP score for your power zones. You accept the number, and then your zones are pre-set for your next class.
Another thing to point out is that technically, you’ve long been able to do a 2km distance test on the row, or a 1 mile distance test on the Bike. Around two years ago, Peloton updated the “Just Work Out” feature to have goals – including time or distance.
With that update, you were able to pick a distance goal, and set it to be a 2km row, or a 1 mile row. If you did this (which you can still do today), the experience is very similar to the new benchmark tests.
There is no music, and it is simply you, and the metrics on the screen as you work to the goal. However, with the Just Work Out distance version, there is no 5 minute warm-up – the test simply starts. In addition, there is no support for comparing these tests over time like there is with the benchmark tests – which is the big addition being brought with the new features this week. There is also no leaderboard shown of you against a previous effort or your PR.
With the recent addition of pace target classes for Tread, a frequent question has been “How do I know what level to set my pace targets to”. While there are Intro to Pace Target classes to help you gauge if you have found the pace targets – these new benchmark classes will give members another way to try to calculate and set their pace targets.
However, even for people who don’t plan to use pace targets, this can be a way in the Peloton ecosystem for people to start comparing and tracking their performance over time – without having to rely on spreadsheets, or third party tools.
What do you think of the new benchmark tests on Peloton?
Support the site! Enjoy the news & guides we provide? Help us keep bringing you the news. Pelo Buddy is completely free, but you can help support the site with a one-time or monthly donation that will go to our writers, editors, and more. Find out more details here.
Get Our Newsletter Want to be sure to never miss any Peloton news? Sign up for our newsletter and get all the latest Peloton updates & Peloton rumors sent directly to your inbox.
Definitely a missed opportunity here – I’ve long used a 2K scenic row for this purpose – it’s far more motivating to look at water and scenery (even if Peloton’s videos show you moving forward vs. ‘backward’ the way you would in a real shell ;), and have Peloton Radio music playing if you don’t want to use your own playlist. The only ‘pro’ to this is the warmup feature that leads straight into the assessment, allowing you to get to full power before the test starts compared to just row or scenic row.
I do hope this is a precursor to more metrics-based features. I’m still really regretting not getting a Concept2 – I thought it would be imminent that Peloton would add the incredibly basic and necessary feature of having programmed workouts (ex: 8x500m, 2:00 rest) but it’s been 18 months with no such update. I end up blowing my rest breaks setting up new 500m or 1K intervals vs. paddling which drives me crazy, not to mention it’s hard to use the last few seconds of rest to get to full power if you can’t row until after hitting the ‘start’ button. Peloton row is great for the classes and distraction of the scenic row, but it’s clearly not made for anyone wanting to create standard rowing training workouts as part of their fitness routine.