
The first edition of Pelothon ended on Sunday night, with more than 324,000 members of the Peloton community having taken part in it (for context, there are around 2.5 million total Peloton members). This means about 12% of the overall Peloton community took part in the challenge. Officially, Pelothon was not a competition and there are no winners. Unofficially – the data says that based on the percentage of each team who successfully completed all 4 weeks’ worth of challenges, #BreakthroughCrew came out as the unofficial team winners for Pelothon 2020.
The real winners of the challenge are the 4 charities, who between them, will receive $1 million dollars. The charities for Pelothon 2020 were Food Bank For New York City, The Trussell Trust, Die Tafel, and Daily Bread Food Break. Each organization received a donation of $250,000 each.
If you missed out on the challenge, or are curious what the rules and specific guidelines were, our Pelothon 2020 Guide is a good resource to check out! For anyone who is interested in some detailed completion stats and progress throughout the challenge, we will break down the overall, and weekly, data below. Note that the data contained here comes from Peloton’s Pelothon 2020 Recap page, as well as the individual week pages.
Overall Pelothon 2020 Results
Given that each team had a different number of participants (members were able to pick their own team), the most fair way to rank the results is based on % completion. So to calculate the overall results, we look at the percentage of members from each team who completed the requirements for all four weeks.
| Team | # of Members on Team | # of Members Who Completed All 4 Weeks | % of Team Who Completed all 4 Weeks |
|---|---|---|---|
| #BreakthroughCrew | 79,576 | 25,497 | 32.04% |
| #NoLimitLegion | 60,521 | 19,177 | 31.69% |
| #GritAndGraceGang | 48,269 | 14,609 | 30.27% |
| #LegendsOfFun | 67,684 | 18,607 | 27.49% |
| #HouseOfShine | 36,438 | 9,945 | 27.29% |
| #TheUnstoppables | 32,302 | 7,943 | 24.59% |
| Overall | 324,790 | 95,778 | 29.49% |
Overall, #BreakthroughCrew had the highest completion rate over all four weeks, followed by #NoLimitLegion and #GritAndGraceGang. We’ll now look at each of the individual weekly statistics and results.
Week 1 Pelothon 2020 Results & Stats
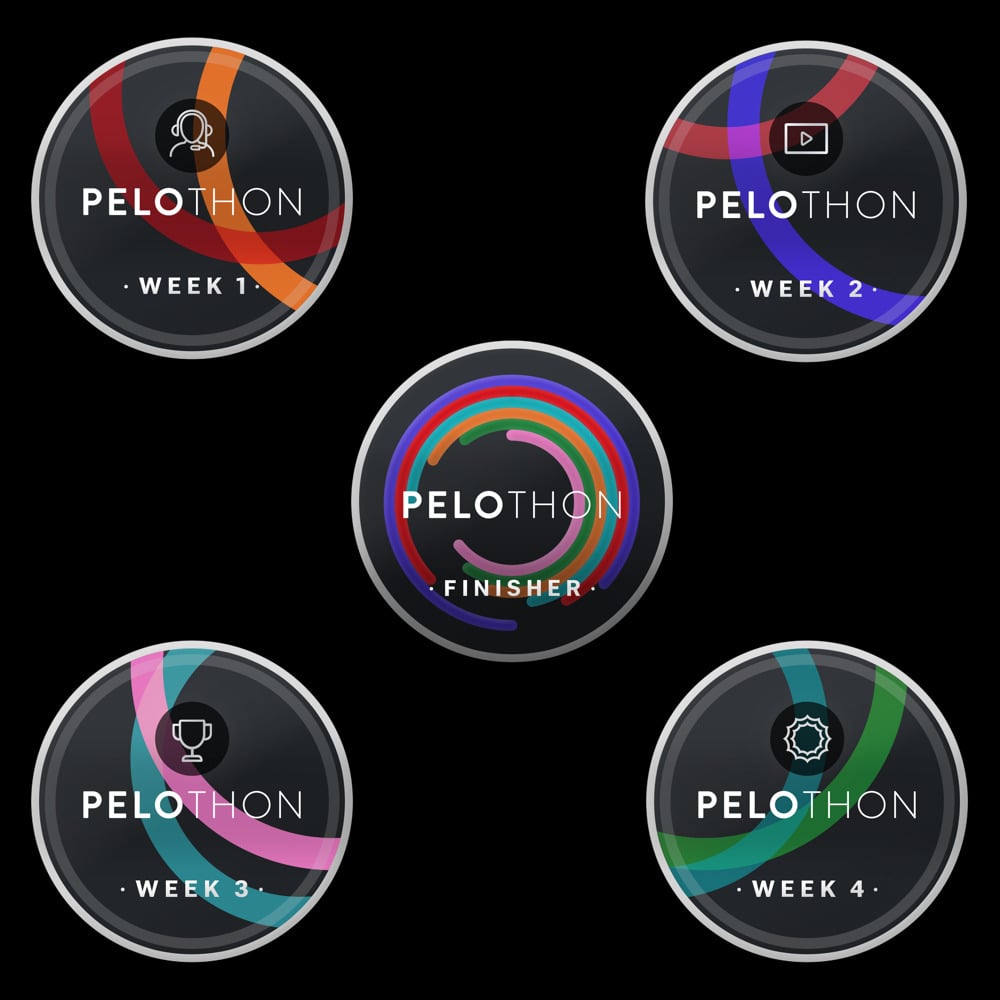
Requirements: Take 1 class with every coach from your team
The first table looks at the percentage of each team who completed the task for Week 1 of taking a class with every instructor from their team
| Team | # of Members on Team | # of Members Who Completed Week 1 | % of Team Who Completed Week 1 |
|---|---|---|---|
| #BreakthroughCrew | 79,576 | 38,754 | 48.70% |
| #NoLimitLegion | 60,521 | 29,460 | 48.68% |
| #GritAndGraceGang | 48,269 | 22,632 | 46.89% |
| #HouseOfShine | 36,438 | 15,202 | 41.72% |
| #LegendsOfFun | 67,684 | 27,972 | 41.33% |
| #TheUnstoppables | 32,302 | 11,775 | 36.45% |
| Overall | 324,790 | 145,795 | 44.89% |
In addition to the number of members who successfully completed the Week 1 requirements, Peloton also shared the total number of classes with their own coach that were taken by each team. With that data, we are able to calculate the average number of classes (with coaches from their own team) taken by each team member during the week. Even though half of the teams had five coaches, while the other half had six, this didn’t really shake up the results for the week that much, with only #GritAndGraceGang and #HouseOfShine swapping positions.
| Team | # of Members on Team | # of Classes Taken by Team | # of Classes / Member |
|---|---|---|---|
| #BreakthroughCrew | 79,576 | 477,106 | 6.00 |
| #NoLimitLegion | 60,521 | 360,984 | 5.96 |
| #HouseOfShine | 36,438 | 205,144 | 5.63 |
| #GritAndGraceGang | 48,269 | 258,671 | 5.36 |
| #LegendsOfFun | 67,684 | 357,915 | 5.29 |
| #TheUnstoppables | 32,302 | 150,992 | 4.67 |
| Overall | 324,790 | 1,810,812 | 5.58 |
Week 2 Pelothon 2020 Results & Stats
Requirements: Take any two live classes
Week 2 ended up being the most “difficult” week of the challenge, based on the percent of each team who completed the week (overall completion rate for all teams was 42.63%). This is likely due to people having difficulty finding live classes that worked for their schedule.
We will first look at the percentage of each team who completed any two live classes during Week 2
| Team | # of Members on Team | # of Members Who Completed Week 2 | % of Team Who Completed Week 2 |
|---|---|---|---|
| #BreakthroughCrew | 79,576 | 36,039 | 45.29% |
| #NoLimitLegion | 60,521 | 27,148 | 44.86% |
| #GritAndGraceGang | 48,269 | 20,932 | 43.37% |
| #LegendsOfFun | 67,684 | 27,344 | 40.40% |
| #HouseOfShine | 36,438 | 14,693 | 40.32% |
| #TheUnstoppables | 32,302 | 12,292 | 38.05% |
| Overall | 324,790 | 138,448 | 42.63% |
Peloton also shared the total number of live classes completed by the members on each team. With that, we’ll look at the average number of live classes taken by each team member (this includes team members who may not have successfully completed Week 2)
| Team | # of Members on Team | # of Live Classes Taken by Team | # of Classes / Member |
|---|---|---|---|
| #NoLimitLegion | 60,521 | 92,179 | 1.52 |
| #BreakthroughCrew | 79,576 | 118,905 | 1.49 |
| #GritAndGraceGang | 48,269 | 71,541 | 1.48 |
| #LegendsOfFun | 67,684 | 94,173 | 1.39 |
| #HouseOfShine | 36,438 | 50,636 | 1.39 |
| #TheUnstoppables | 32,302 | 44,211 | 1.37 |
| Overall | 324,790 | 471,645 | 1.45 |
Week 2 had the extra twist of having a challenge you had to opt into in, in addition to completing the classes. While Peloton ended up awarding badges regardless of whether you had opted into the challenge, we can still see how that impacted completion percentages. First, we’ll look at what percentage of the team actually opted into the challenge for the week.
| Team | # of Members on Team | # of Members Who Opted Into Week 2 Challenge | % of Members Who Opted Into Week 2 Challenge |
|---|---|---|---|
| #BreakthroughCrew | 79,576 | 46,103 | 57.94% |
| #NoLimitLegion | 60,521 | 34,944 | 57.74% |
| #GritAndGraceGang | 48,269 | 26,996 | 55.93% |
| #HouseOfShine | 36,438 | 19,323 | 53.03% |
| #LegendsOfFun | 67,684 | 35,773 | 52.85% |
| #TheUnstoppables | 32,302 | 16,306 | 50.48% |
| Overall | 324,790 | 179,445 | 55.25% |
Using that data, we’ll then re-rank the overall Week 2 results – but rather than basing the percentage based on total number of members on the team, we’ll use the total number of members who had opted into Week 2. While the gap between teams slightly changed, this did not impact the overall order for the week.
| Team | # of Members Who Opted Into Week 2Challenge | # of Members Who Completed Week 2 | % of Team Who Completed Week 2 out of those who opted into Week 2 challenge |
|---|---|---|---|
| #BreakthroughCrew | 46,103 | 36,039 | 78.17% |
| #NoLimitLegion | 34,944 | 27,148 | 77.69% |
| #GritAndGraceGang | 26,996 | 20,932 | 77.54% |
| #LegendsOfFun | 35,773 | 27,344 | 76.44% |
| #HouseOfShine | 19,323 | 14,693 | 76.04% |
| #TheUnstoppables | 16,306 | 12,292 | 75.38% |
| Overall | 179,445 | 138,448 | 77.15% |
Week 3 Pelothon 2020 Results & Stats
Requirements: Work out 5 days this week
Week 3 had the highest overall completion rate out of the four weeks, with the average across all teams being 48.37%
| Team | # of Members on Team | # of Members Who Completed Week 3 | % of Team Who Completed Week 3 |
|---|---|---|---|
| #BreakthroughCrew | 79,576 | 40,855 | 51.34% |
| #NoLimitLegion | 60,521 | 30,772 | 50.85% |
| #GritAndGraceGang | 48,269 | 23,368 | 48.41% |
| #HouseOfShine | 36,438 | 17,108 | 46.95% |
| #LegendsOfFun | 67,684 | 31,097 | 45.94% |
| #TheUnstoppables | 32,302 | 13,898 | 43.03% |
| Overall | 324,790 | 157,098 | 48.37% |
Similar to the previous week, members also had to opt into a challenge for Week 3. Here is the breakdown of how many and what percent of each team opted into the Week 3 challenge.
| Team | # of Members on Team | # of Members Who Opted into Week 3 Challenge | % of Team Who Opted into Week 3 Challenge |
|---|---|---|---|
| #NoLimitLegion | 60,521 | 38,953 | 64.36% |
| #BreakthroughCrew | 79,576 | 51,174 | 64.31% |
| #GritAndGraceGang | 48,269 | 29,952 | 62.05% |
| #HouseOfShine | 36,438 | 21,926 | 60.17% |
| #LegendsOfFun | 67,684 | 40,158 | 59.33% |
| #TheUnstoppables | 32,302 | 18,377 | 56.89% |
| Overall | 324,790 | 200,540 | 61.74% |
For this week, Peloton shared the number of “Active Days” that each team completed (which is the total number of days worked out). However, the number shared for this week was only the number of Active Days by members who had opted into the challenge – so keep in mind that the data shown in the table below, and percentages, is only out of the team members who opted into Week 3.
| Team | # of Members on Team opted Into Week 3 Challenge | # of Active Days during Week 3 | # of active days / Member |
|---|---|---|---|
| #BreakthroughCrew | 51,174 | 273,905 | 5.35 |
| #NoLimitLegion | 38,953 | 206,968 | 5.31 |
| #HouseOfShine | 21,926 | 116,071 | 5.29 |
| #GritAndGraceGang | 29,952 | 158,274 | 5.28 |
| #LegendsOfFun | 40,158 | 210,624 | 5.24 |
| #TheUnstoppables | 18,377 | 95,037 | 5.17 |
| Overall | 200,540 | 1,060,879 | 5.29 |
Finally, we’ll again use the number of team members who opted into Week 3 to re-rank the overall Week 3 results, basing the percentages on opted in numbers, instead of overall numbers. With this new calculation, #GritAndGraceGang and #HouseOfShine swapped third and fourth spot for the week.
| Team | # of Members Who Opted Into Week 3 Challenge | # of Members Who Completed Week 3 | % of Team Who Completed Week 3 out of those who opted into challenge |
|---|---|---|---|
| #BreakthroughCrew | 51,174 | 40,855 | 79.84% |
| #NoLimitLegion | 38,953 | 30,772 | 79.00% |
| #HouseOfShine | 21,926 | 17,108 | 78.03% |
| #GritAndGraceGang | 29,952 | 23,368 | 78.02% |
| #LegendsOfFun | 40,158 | 31,097 | 77.44% |
| #TheUnstoppables | 18,377 | 13,898 | 75.63% |
| Overall | 200,540 | 157,098 | 78.34 |
Week 4 Pelothon 2020 Results & Stats
Requirements: Take one of six “Pelothon 2020” classes
Week 4’s requirement was in theory the simplest: you simply had to take one class, as long as it was one of the six “Pelothon 2020” classes. However, some members probably dropped out of the challenge as the Pelothon went on, otherwise one would imagine Week 4 would have had the highest completion rate.
| Team | # of Members on Team | # of Members Who Completed Week 4 | % of Team Who Completed Week 4 |
|---|---|---|---|
| #BreakthroughCrew | 79,576 | 38,349 | 48.19% |
| #NoLimitLegion | 60,521 | 29,135 | 48.14% |
| #GritAndGraceGang | 48,269 | 22,373 | 46.35% |
| #HouseOfShine | 36,438 | 16,809 | 46.13% |
| #LegendsOfFun | 67,684 | 29,223 | 43.18% |
| #TheUnstoppables | 32,302 | 12,814 | 39.67% |
| Overall | 324,790 | 148,703 | 45.78% |
For Week 4, Peloton shared the number of Pelothon 2020 classes that were taken by each team. If members took the same class twice, or multiple ones, this helped contribute to the team numbers.
| Team | # of Members on Team | # of Classes Taken by Team | # of Classes / Member |
|---|---|---|---|
| #NoLimitLegion | 60,521 | 38,980 | 0.644 |
| #BreakThroughCrew | 79,576 | 49,681 | 0.624 |
| #GritAndGraceGang | 48,269 | 29,843 | 0.618 |
| #HouseOfShine | 36,438 | 21,862 | 0.600 |
| #LegendsOfFun | 67,684 | 38,053 | 0.562 |
| #TheUnstoppables | 32,302 | 17,182 | 0.532 |
| Overall | 324,790 | 195,601 | 0.602 |
We can also calculate this based only on the number of people who completed the challenge – or took at least one class. This excludes people who might have dropped out of the challenge by this point, or just didn’t have time this week.
| Team | # of Members who Completed Week 4 | # of Classes Taken by Team | # of Classes / Member |
|---|---|---|---|
| #TheUnstoppables | 12,814 | 17,182 | 1.341 |
| #NoLimitLegion | 29,135 | 38,980 | 1.338 |
| #GritAndGraceGang | 22,373 | 29,843 | 1.334 |
| #LegendsOfFun | 29,223 | 38,053 | 1.302 |
| #HouseOfShine | 16,809 | 21,862 | 1.301 |
| #BreakThroughCrew | 38,349 | 49,681 | 1.295 |
| Overall | 148,703 | 195,601 | 1.315 |
And with that, Pelothon 2020 is a wrap! One interesting statistic is that Peloton shared the top 3 classes for each team during the challenge (which you can browse at your leisure here). However, for all 6 teams, one of the 3 classes was Cody Rigsby’s 30 minute Britney Spears ride. Even with the friendly team rivalry going on, it appears that there are some classes that members had to put the rankings aside for and come together to workout on!
We can imagine this will be something Peloton will try again in the future. Stay tuned for details when they do!
Support the site! Enjoy the news & guides we provide? Help us keep bringing you the news. Pelo Buddy is completely free, but you can help support the site with a one-time or monthly donation that will go to our writers, editors, and more. Find out more details here.
Get Our Newsletter Want to be sure to never miss any Peloton news? Sign up for our newsletter and get all the latest Peloton updates & Peloton rumors sent directly to your inbox.
Leave a Reply